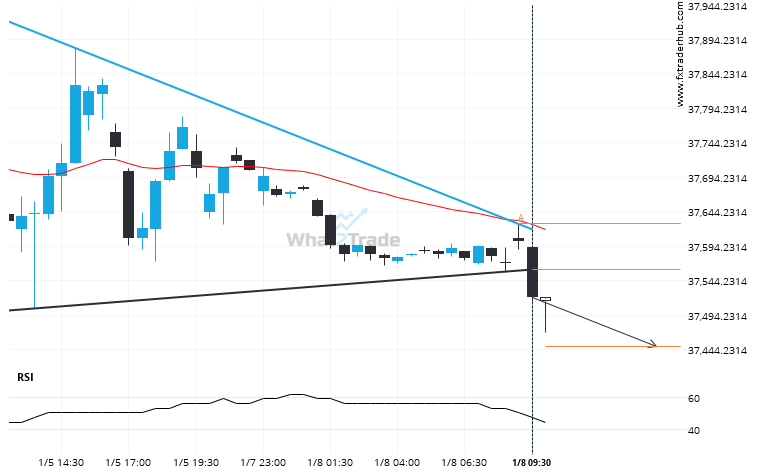
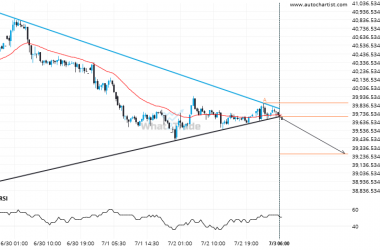
US30 moved through the support line of a Triangle at 37560.02857142857 on the 30 Minutes chart. This line has been tested a number of times in the past and this breakout could mean an upcoming change from the current trend. It may continue in its current direction toward 37448.7353.
Related Posts
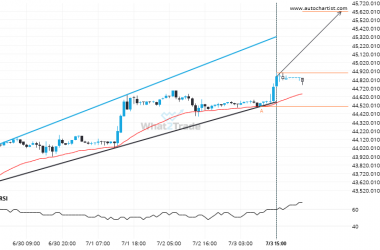
DOW 30 is quickly approaching the resistance line of a Channel Up. We expect either a breakout through this line or a rebound.
An emerging Channel Up has been detected on DOW 30 on the 1 hour chart. There is a…
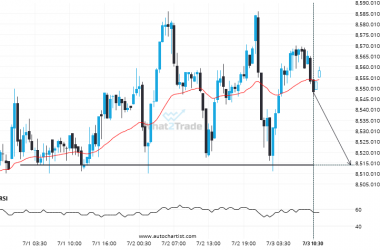
ASX 200 heading towards a price it has tested 5 times in the recent past.
The price of ASX 200 in heading back to the support area. It is possible that it will…
Nikkei 225 – breach of a trending support line that has been tested at least twice before.
The last 8 30 Minutes candles on Nikkei 225 formed a Triangle pattern and broken out through the…

