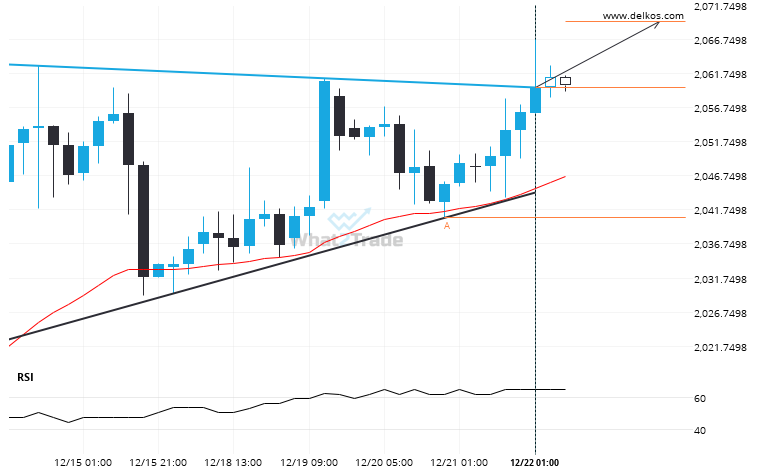
Gold February 2024 moved through the resistance line of a Ascending Triangle at 2059.6 on the 4 hour chart. This line has been tested a number of times in the past and this breakout could mean an upcoming change from the current trend. It may continue in its current direction toward 2069.3661.
Related Posts
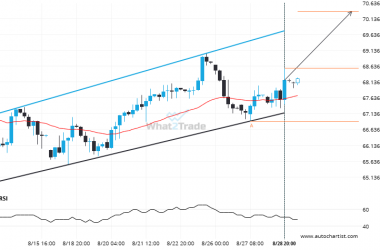
A Channel Up has formed, Brent Crude is approaching support. Can we expect a breakout and the start of a new trend or a reversal?
Brent Crude was identified at around 68.572 having recently rebounded of the support on the 4 hour data…
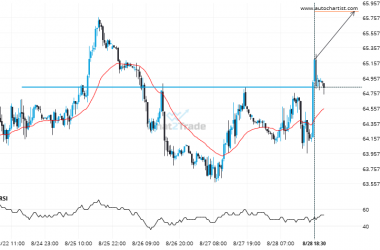
After trying numerous times in the past, US Oil finally breaks 64.8375!
The breakout of US Oil through the 64.8375 price line is a breach of an important psychological price…
Because Gold Spot formed a Rising Wedge pattern, we expect it to touch the resistance line. If it breaks through resistance it may move much higher
Gold Spot is trapped in a Rising Wedge formation, implying that a breakout is Imminent. This is a…

