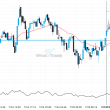
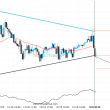
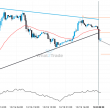
GBP/USD has broken through a support line of a Triangle chart pattern. If this breakout holds true, we may see the price of GBP/USD testing 1.2600 within the next 2 days. But don’t be so quick to trade, it has tested this line in the past, so you should confirm the breakout before taking any action.
Related Posts
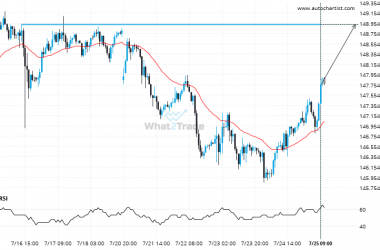
USDJPY heading towards a price it has tested 4 times in the recent past.
The movement of USDJPY towards 148.9320 price line is yet another test of the line it reached numerous…
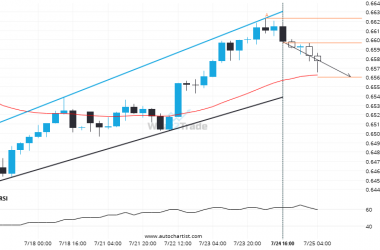
Because AUDUSD formed a Channel Up pattern, we expect it to touch the support line. If it breaks through support it may move much lower
AUDUSD is moving towards a support line which it has tested numerous times in the past. We have…
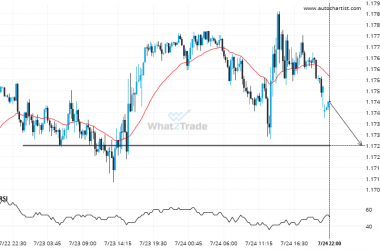
Will EURUSD break through the support level it tested before?
EURUSD is heading towards 1.1728 and could reach this point within the next 11 hours. It has tested…

