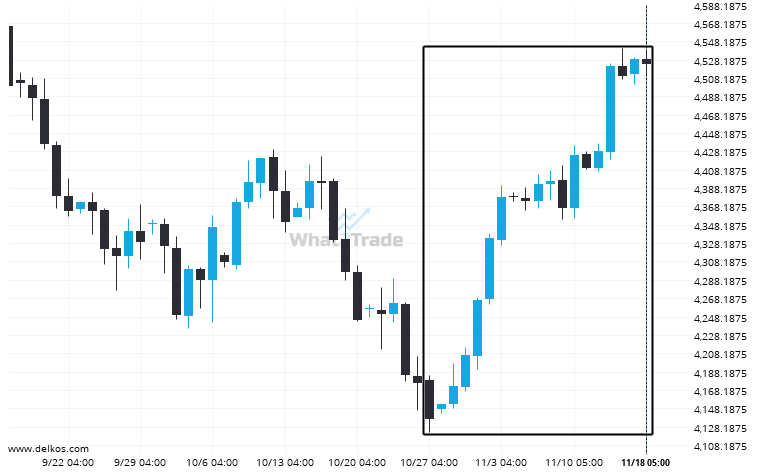
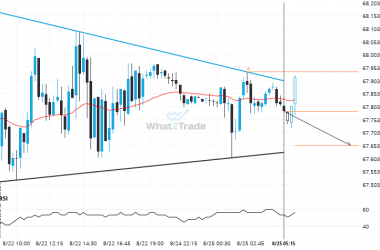
E-mini S&P 500 DECEMBER 2023 dropped sharply for 22 days – which is an excessively big movement for this instrument; exceeding the 98% of past price moves. Even if this move is a sign of a new trend in E-mini S&P 500 DECEMBER 2023 there is a chance that we will witness a correction, no matter how brief.
Related Posts
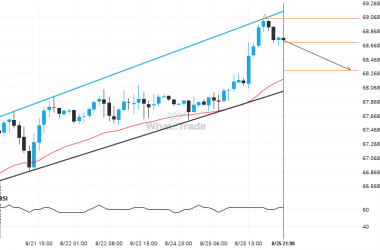
Brent Crude formed a Channel Up on the 1 hour chart. Retest of support in sight.
Brent Crude is moving towards a support line which it has tested numerous times in the past. We…
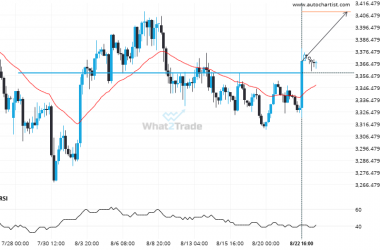
Big movement possible on Gold Spot after a breach of 3358.4751
Gold Spot has breached the resistance line at 3358.4751. It may continue the bullish trend towards 3408.8755, or,…
Brent Crude formed a Triangle on the 15 Minutes chart. Retest of support in sight.
Emerging Triangle detected on Brent Crude – the pattern is an emerging one and has not yet broken…

