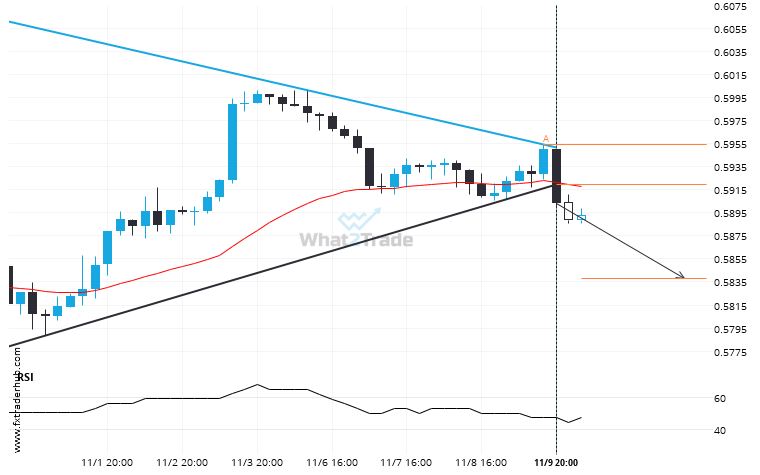
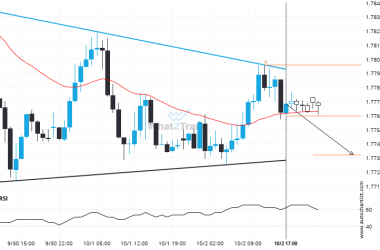
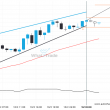
The last 15 4 hour candles on NZD/USD formed a Triangle pattern and broken out through the pattern lines, indicating a possible bearish movement towards the price level of 0.5839.
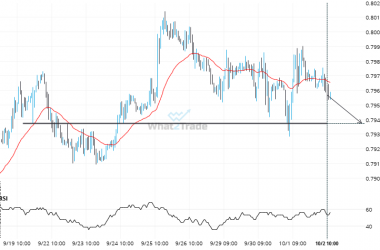
Related Posts
After experiencing a 3.45% bullish move in the space of 9 days, nobody knows where GBPUSD is headed.
An unexpected large move has occurred on GBPUSD Daily chart beginning at 1.27331 and ending at 1.317255. Is…
AUDUSD seems to be on its way to resistance – a possible opportunity?
The price of AUDUSD in heading back to the resistance area. It is possible that it will struggle…
Important resistance line being approached by USDCAD. This price has been tested numerous time in the last 23 days
An emerging Channel Down has been detected on USDCAD on the 4 hour chart. There is a possible…