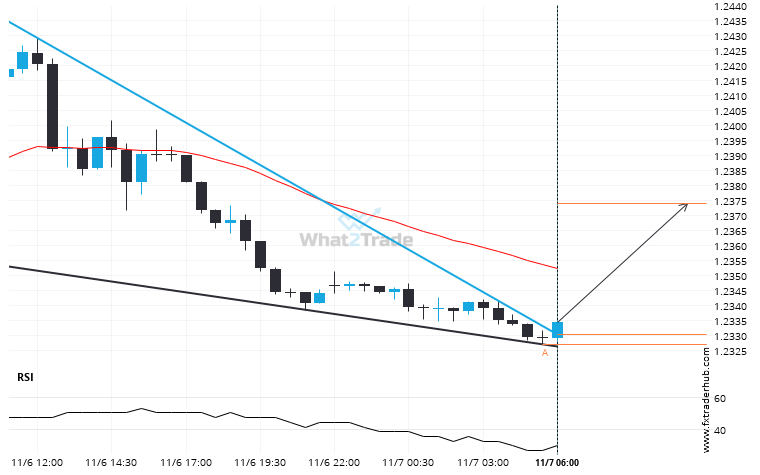
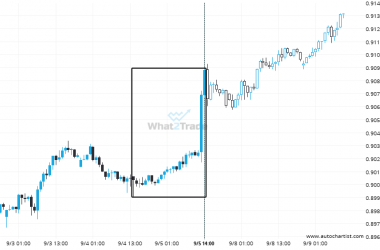
GBP/USD moved through the resistance line of a Falling Wedge at 1.2330022580645161 on the 30 Minutes chart. This line has been tested a number of times in the past and this breakout could mean an upcoming change from the current trend. It may continue in its current direction toward 1.2374.
Related Posts
Because USDJPY formed a Channel Down pattern, we expect it to touch the resistance line. If it breaks through resistance it may move much higher
USDJPY is heading towards the resistance line of a Channel Down and could reach this point within the…
A Channel Up has formed, EURUSD is approaching resistance. Can we expect a breakout and the start of a new trend or a reversal?
EURUSD is trapped in a Channel Up formation, implying that a breakout is Imminent. This is a great…
A very large move was recorded on AUDCAD. The size of the shift is exceptional.
AUDCAD reached 0.909115 after a 0.94% move spanning 2 days.


