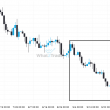
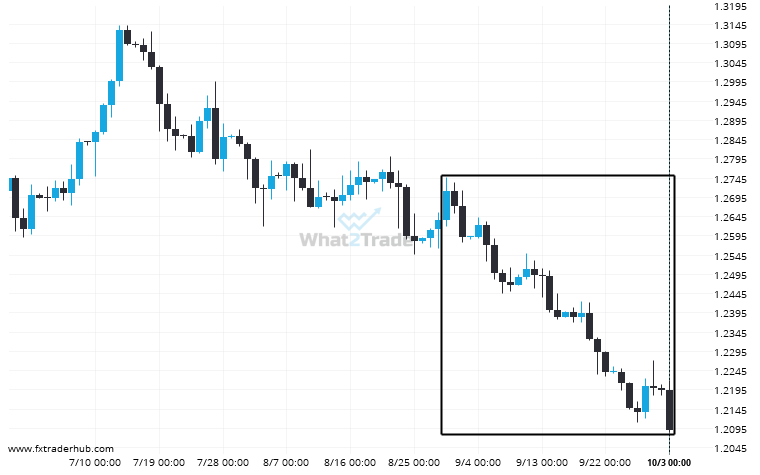
GBP/USD has moved lower by 4.89% from 1.27115 to 1.20901 in the last 35 days.
Related Posts
GBPJPY formed a Falling Wedge on the 4 hour chart. Retest of support in sight.
The movement of GBPJPY towards the support line of a Falling Wedge is yet another test of the…
Will AUDNZD break through the resistance level it tested before?
A strong resistance level has been identified at 1.0954 on the 1 hour AUDNZD chart. AUDNZD is likely…
EURGBP through 0.8661379310344827. Is this a confirming a breakout? Will it continue its path in the current trend toward 0.8642?
EURGBP has broken through a support line of a Triangle chart pattern. If this breakout holds true, we…