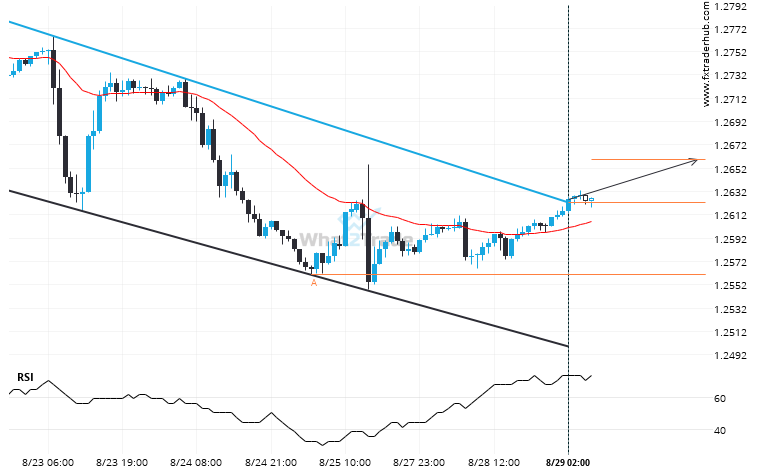
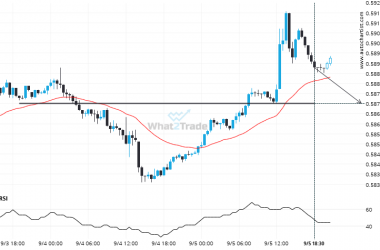
GBP/USD has broken through a resistance line. It has touched this line at least twice in the last 11 days. This breakout may indicate a potential move to 1.2659 within the next 2 days. Because we have seen it retrace from this position in the past, one should wait for confirmation of the breakout before trading.
Related Posts
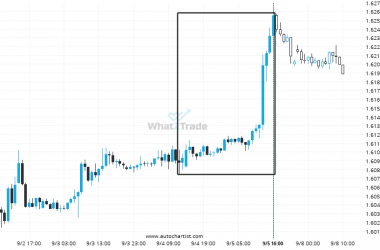
An unexpected large move occurred on EURCAD 1 hour chart. The shift stands out in recent activity.
EURCAD has moved higher by 1.04% from 1.608765 to 1.62552 in the last 2 days.
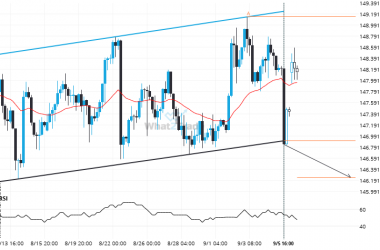
After testing support twice in the past, USDJPY has finally broken through. Can we expect a bearish trend to follow?
USDJPY has broken through a support line of a Channel Up chart pattern. If this breakout holds true,…
NZDUSD is quickly approaching a very important level it has previously tested numerous times in the past
NZDUSD is moving towards a support line. Because we have seen it retrace from this level in the…

