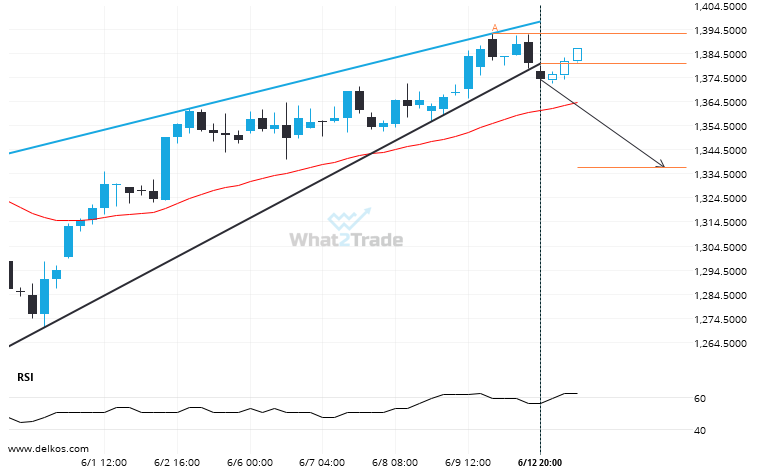
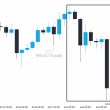
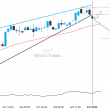
Soybeans JULY 2023 has broken through a support line. It has touched this line at least twice in the last 18 days. This breakout may indicate a potential move to 1337.1974 within the next 2 days. Because we have seen it retrace from this position in the past, one should wait for confirmation of the breakout before trading.
Related Posts
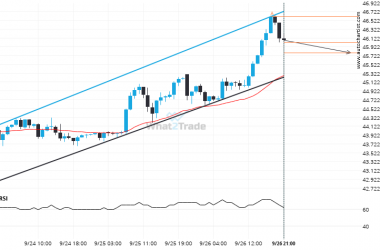
Because Silver Spot formed a Channel Up pattern, we expect it to touch the support line. If it breaks through support it may move much lower
Silver Spot is heading towards the support line of a Channel Up. If this movement continues, the price…
Gold Spot – breach of a trending support line that has been tested at least twice before.
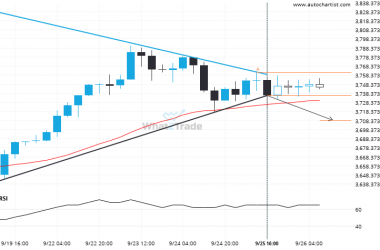
This trade setup on Gold Spot is formed by a period of consolidation; a period in which the…
Gold Spot seems to be on its way to resistance – a possible opportunity?
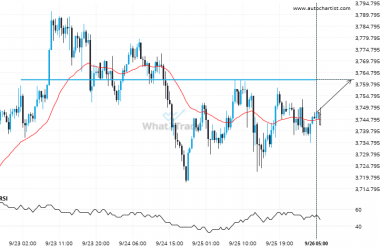
Gold Spot is approaching a resistance line at 3761.6851. If it hits the resistance line, it may break…

