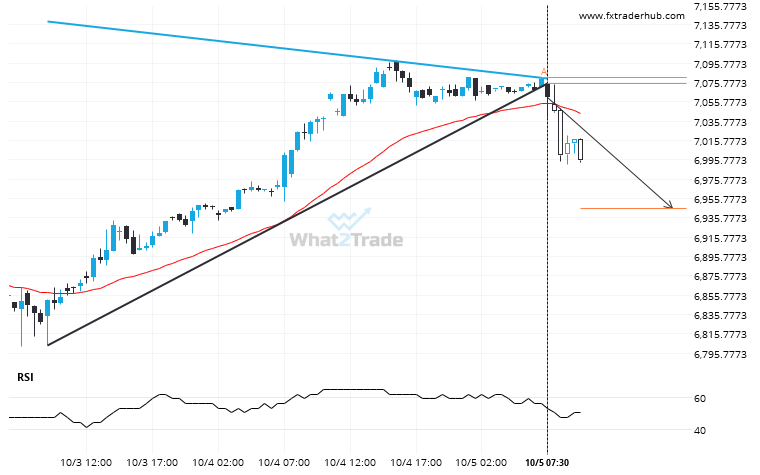
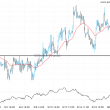
UK100 has broken through a support line of a Triangle and suggests a possible movement to 6945.2451 within the next 10 hours. It has tested this line in the past, so one should probably wait for a confirmation of this breakout before taking action. If the breakout doesn’t confirm, we could see a retracement back to lines seen in the last 2 days.
Related Posts
FTSE 100 is signaling a possible trend reversal on the intraday charts with price not breaching support.
Emerging Channel Up pattern in its final wave was identified on the FTSE 100 1 hour chart. After…
Important price line being approached by DAX 40. This price has been tested numerous times before.
DAX 40 is heading towards a line of 24506.1992. If this movement continues, the price of DAX 40…
ASX 200 is quickly approaching the support line of a Falling Wedge. We expect either a breakout through this line or a rebound.
A Falling Wedge pattern was identified on ASX 200 at 8609.0, creating an expectation that it may move…