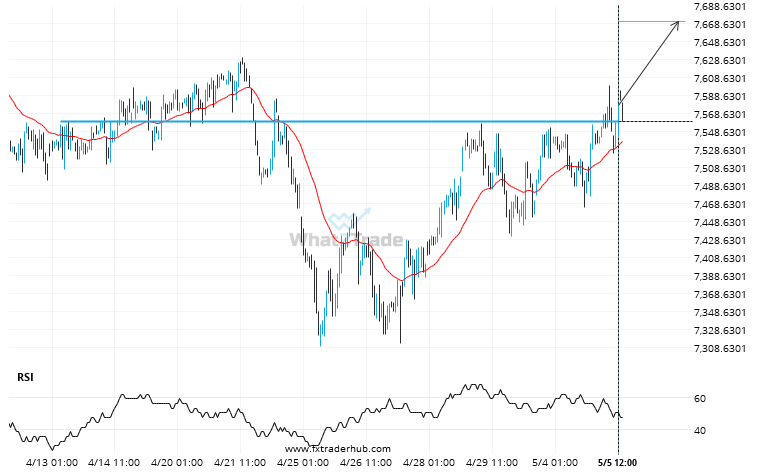
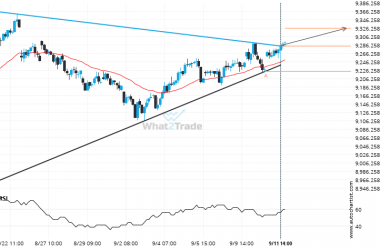
UK100 has broken through 7560.0000 which it has tested numerous times in the past. We have seen it retrace from this price in the past. If this new trend persists, UK100 may be heading towards 7670.6001 within the next 3 days.
Related Posts
FTSE 100 is signaling a possible trend reversal on the intraday charts with price not breaching resistance.
An emerging Channel Up has been detected on FTSE 100 on the 4 hour chart. There is a…
After testing 44490.4492 numerous times, DOW 30 has finally broken through. Can we expect a bearish trend to follow?
DOW 30 has broken through 44490.4492 which it has tested numerous times in the past. We have seen…
US 500 has broken through resistance of a Triangle. It has touched this line at least twice in the last 6 days.
US 500 has broken through a resistance line of a Triangle chart pattern. If this breakout holds true,…