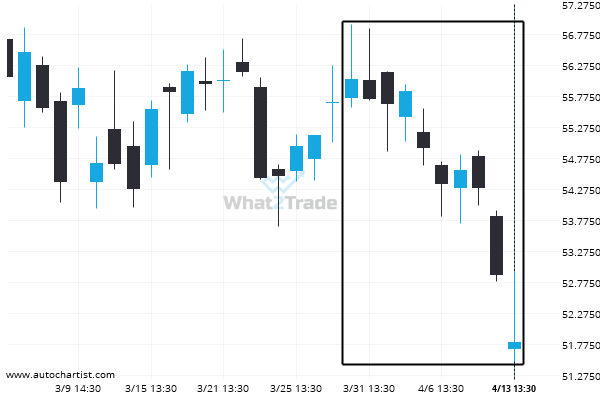
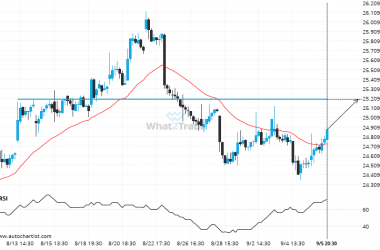
A movement of 7.56% over 15 days on Cisco Systems Inc. doesn’t go unnoticed. You may start considering where it’s heading next, a continuation of the current downward trend, or a reversal in the previous direction.
Related Posts
TSLA formed a Triangle on the 1 hour chart. Retest of support in sight.
TSLA is trapped in a Triangle formation, implying that a breakout is Imminent. This is a great trade-setup…
XOM – breach of price line that’s been previously tested numerous times before
XOM is once again retesting a key horizontal resistance level at 109.5450. It has tested this level 4…
Breach of support could mean a start of a bearish trend on MSFT
MSFT has broken through a support line of a Triangle chart pattern. If this breakout holds true, we…