
LTCUSD has broken through a resistance line of a Triangle chart pattern. If this breakout holds true, we may see the price of LTCUSD testing 129.7366 within the next 21 hours. But don’t be so quick to trade, it has tested this line in the past, so you should confirm the breakout before taking any action.
Related Posts
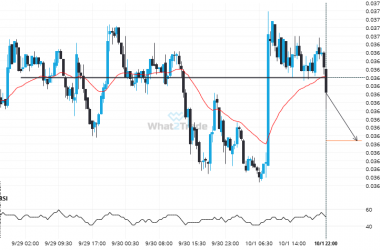
Important price line breached by ETHBTC. This price has been tested numerous times before.
ETHBTC has broken through a line of 0.0367. If this breakout holds true, we could see the price…
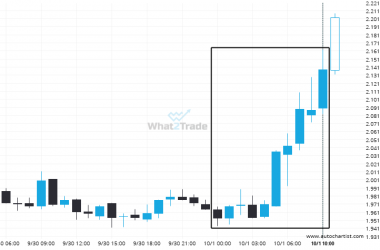
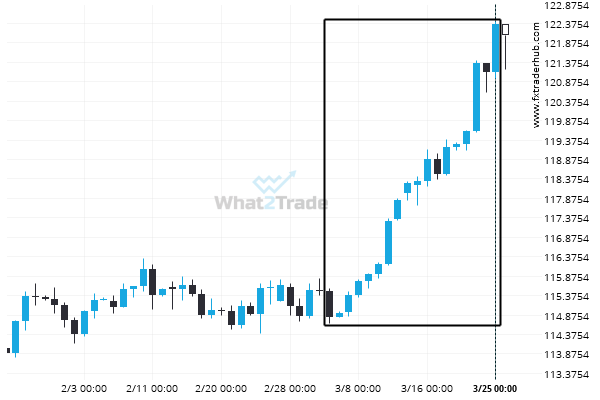
DASHBTC – Large moves like this tend to draw attention.
DASHBTC reached 0.0002138 after a 9.47% move spanning 10 hours.
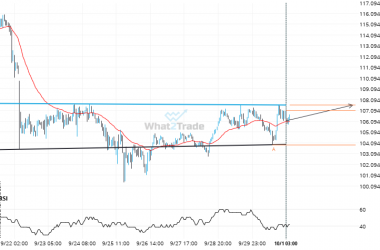
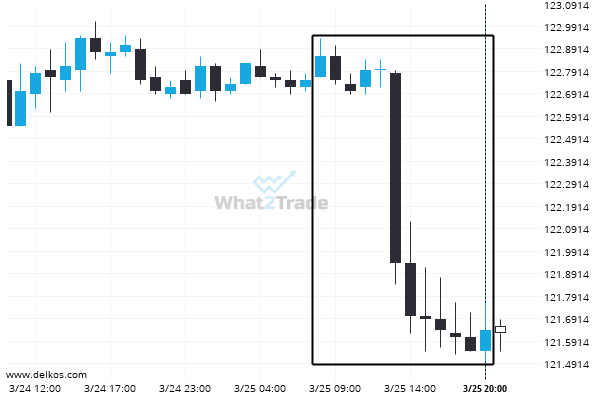
LTCUSD is approaching a resistance line of a Inverse Head and Shoulders. It has touched this line numerous times in the last 10 days.
LTCUSD is heading towards the resistance line of a Inverse Head and Shoulders and could reach this point…