
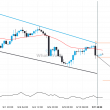
USD/CHF has broken through the resistance line of a Falling Wedge technical chart pattern. Because we have seen it retrace from this line in the past, one should wait for confirmation of the breakout before taking any action. It has touched this line twice in the last 26 days and suggests a possible target level to be around 0.9318 within the next 6 days.
Related Posts
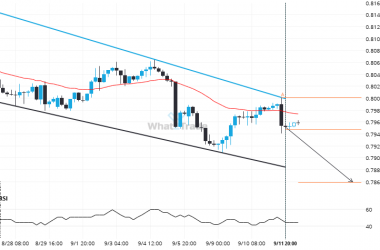
A possible move on USDCHF as it heads towards support
USDCHF is moving towards a support line which it has tested numerous times in the past. We have…
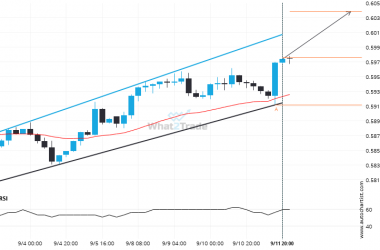
A Channel Up has formed, NZDUSD is approaching support. Can we expect a breakout and the start of a new trend or a reversal?
Emerging Channel Up pattern in its final wave was identified on the NZDUSD 4 hour chart. After a…
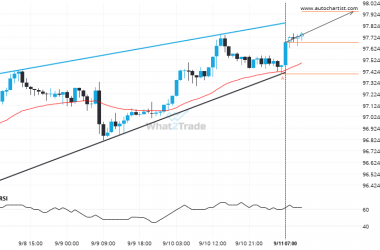
AUDJPY is signaling a possible trend reversal on the intraday charts with price not breaching support.
AUDJPY is moving towards a resistance line which it has tested numerous times in the past. We have…