
BCHGBP has broken through the support line of a Triangle technical chart pattern. Because we have seen it retrace from this line in the past, one should wait for confirmation of the breakout before taking any action. It has touched this line twice in the last 7 days and suggests a possible target level to be around 228.7970 within the next 2 days.
Related Posts
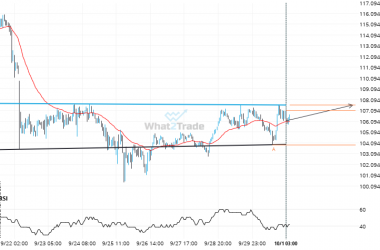
LTCUSD is approaching a resistance line of a Inverse Head and Shoulders. It has touched this line numerous times in the last 10 days.
LTCUSD is heading towards the resistance line of a Inverse Head and Shoulders and could reach this point…
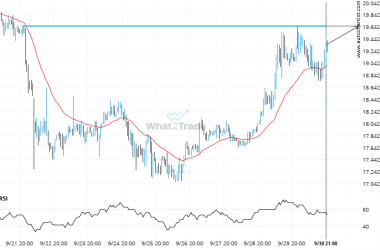
Will DASHEUR break through the resistance level it tested before?
DASHEUR is moving towards a line of 19.6500 which it has tested numerous times in the past. We…
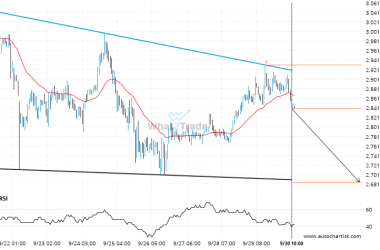
After testing the support line numerous times, XRPUSD is once again approaching this line. Can we expect a bearish trend to follow?
Emerging Descending Triangle pattern in its final wave was identified on the XRPUSD 1 hour chart. After a…