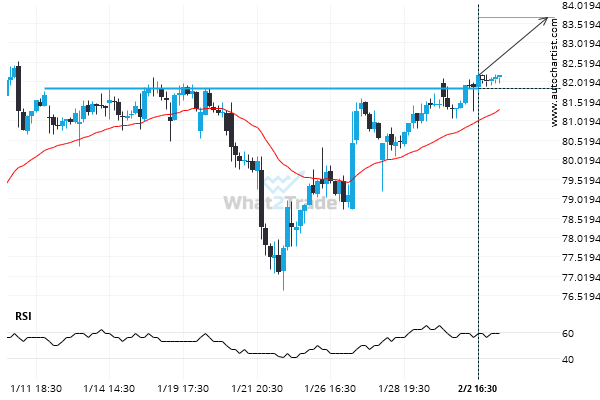
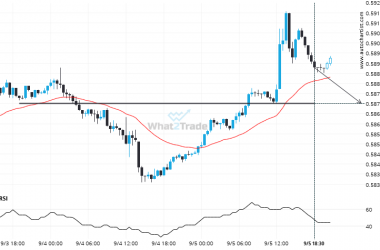
NAS100 is heading towards a line of 14714.5000. If this movement continues, the price of NAS100 could test 14714.5000 within the next 12 hours. But don’t be so quick to trade, it has tested this line numerous times in the past, so this movement could be short-lived and end up rebounding.
Related Posts
GBPJPY formed a Falling Wedge on the 4 hour chart. Retest of support in sight.
The movement of GBPJPY towards the support line of a Falling Wedge is yet another test of the…
Will AUDNZD break through the resistance level it tested before?
A strong resistance level has been identified at 1.0954 on the 1 hour AUDNZD chart. AUDNZD is likely…
EURGBP through 0.8661379310344827. Is this a confirming a breakout? Will it continue its path in the current trend toward 0.8642?
EURGBP has broken through a support line of a Triangle chart pattern. If this breakout holds true, we…