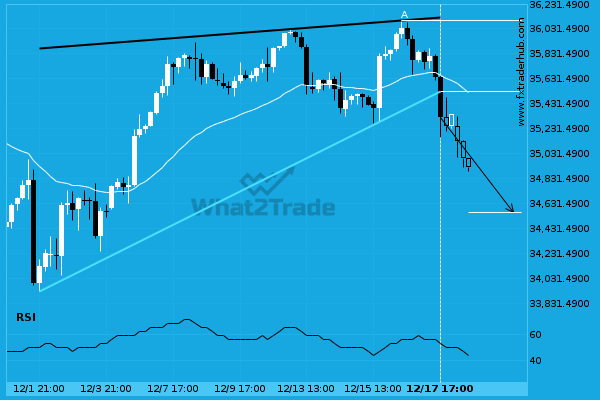
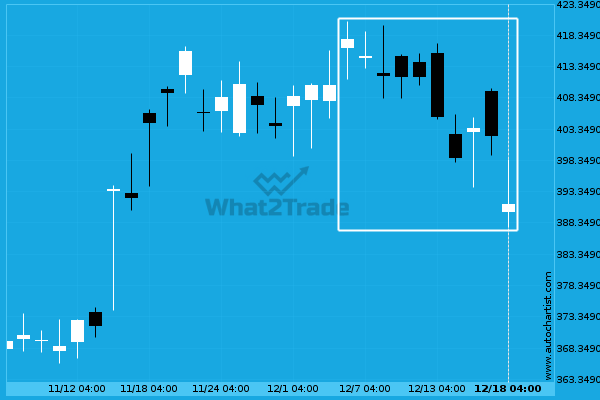
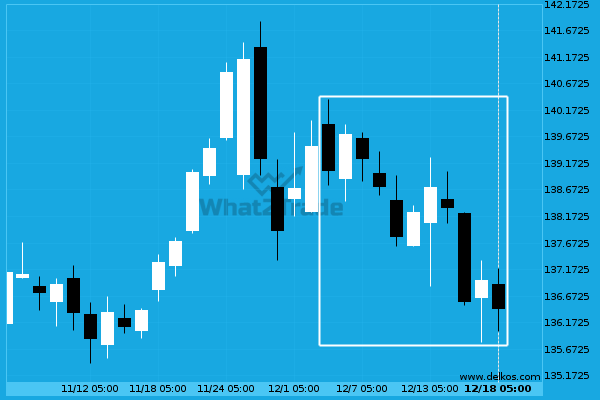
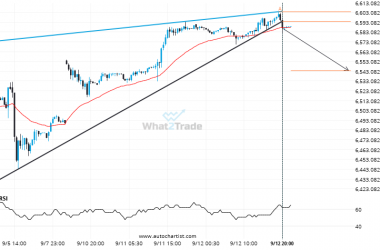
US30 has broken through a support line of a Rising Wedge chart pattern. If this breakout holds true, we may see the price of US30 testing 34557.8156 within the next 2 days. But don’t be so quick to trade, it has tested this line in the past, so you should confirm the breakout before taking any action.
Related Posts
Because NAS 100 formed a Channel Up pattern, we expect it to touch the resistance line. If it breaks through resistance it may move much higher
NAS 100 is approaching the resistance line of a Channel Up. It has touched this line numerous times…
DAX 40 keeps moving closer towards 23863.9004. Will it finally breach this level?
DAX 40 is about to retest a key horizontal resistance level near 23863.9004. It has tested this level…
Breach of support could mean a start of a bearish trend on US 500
This trade setup on US 500 is formed by a period of consolidation; a period in which the…

