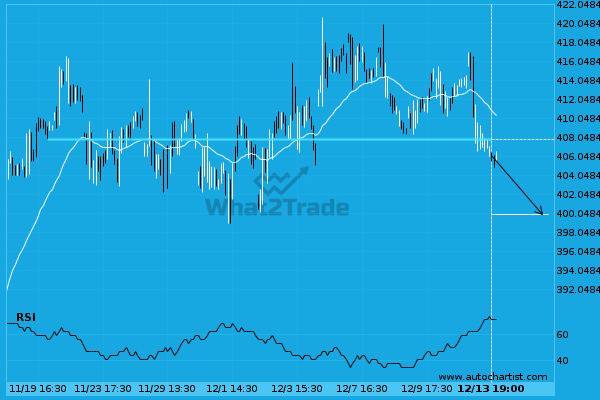
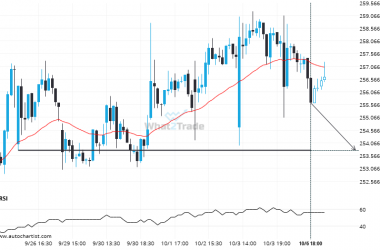
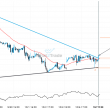
Home Depot Inc. has broken through 407.77 which it has tested numerous times in the past. We have seen it retrace from this price in the past. If this new trend persists, Home Depot Inc. may be heading towards 399.89 within the next 23 hours.
Related Posts
TSLA through 323.62452380952374. Is this a confirming a breakout? Will it continue its path in the current trend toward 369.9006?
TSLA has broken through the resistance line of a Triangle technical chart pattern. Because we have seen it…
V is approaching 338.0450. We expect either a breakout through this line, or a rebound.
V is approaching a resistance line at 338.0450. If it hits the resistance line, it may break through…
NVDA – approaching a resistance line that has been previously tested at least twice in the past
NVDA was identified at around 183.45 having recently rebounded of the support on the 1 hour data interval.…