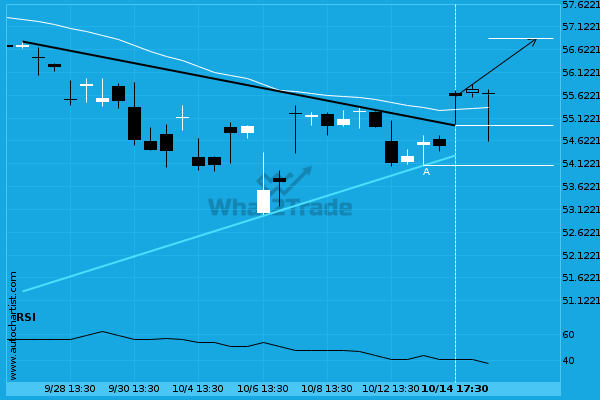
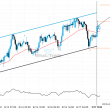
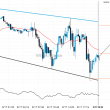
Cisco Systems Inc. has broken through a resistance line of a Triangle chart pattern. If this breakout holds true, we may see the price of Cisco Systems Inc. testing 56.86 within the next 2 days. But don’t be so quick to trade, it has tested this line in the past, so you should confirm the breakout before taking any action.
Related Posts
Breach of resistance could mean a start of a bullish trend on BIDU
BIDU moved through the resistance line of a Falling Wedge at 76.3833333333333 on the 1 hour chart. This…
BABA – It’s perhaps in these huge moves where the greatest opportunity lies
A movement of 28.24% over 23 days on BABA doesn’t go unnoticed. You may start considering where it’s…
Supports and resistances are primary concepts of technical analysis. AAPL is heading for an important price of 223.9350 – read about what this could mean for the future.
AAPL is approaching a resistance line at 223.9350. If it hits the resistance line, it may break through…