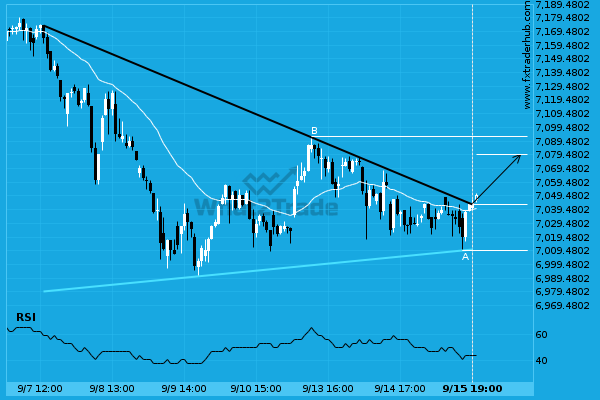
UK100 has broken through the resistance line of a Triangle. It has touched this line at least twice in the last 9 days. This breakout indicates a potential move to 7079.7917 within the next 2 days. Because we have seen it retrace from this positions in the past, one should wait for confirmation of the breakout before trading.
Related Posts
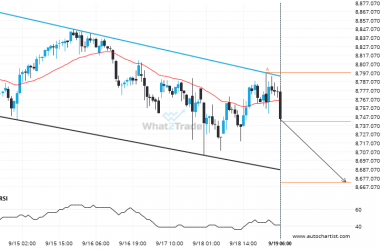
ASX 200 formed a Channel Down on the 1 hour chart. Retest of support in sight.
A Channel Down pattern was identified on ASX 200 at 8742.0, creating an expectation that it may move…
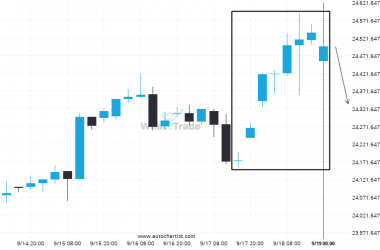
Rare bullish streak on the NAS 100 4 hour chart.
Rare candle sequence recorded on the NAS 100 4 hour chart, ending at 24497.3588.
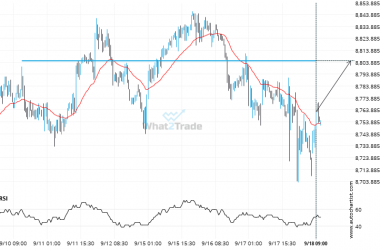
If you’re short ASX 200 you should be aware of the rapidly approaching level of 8805.2998
ASX 200 is heading towards a line of 8805.2998. If this movement continues, the price of ASX 200…

