
Day: December 25, 2019
18 posts
After testing 0.9833 numerous times, USD/CHF is once again approaching this price point. Can we expect a bullish trend to follow?
The movement of USD/CHF towards 0.9833 price line is yet another test of the line it reached numerous…
Important price line being approached by XRPUSD. This price has been tested numerous times before.
XRPUSD is moving towards a line of 0.1867 which it has tested numerous times in the past. We…
Important price line being approached by USD/JPY. This price has been tested numerous times before.
USD/JPY is moving towards a line of 109.4130 which it has tested numerous times in the past. We…
JPN225 – breach of a trending resistance line that has been tested at least twice before.
JPN225 has broken through the resistance line of a Triangle technical chart pattern. Because we have seen it…
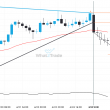
USD/JPY Target Level: 109.3100
Falling Wedge identified at 25-Dec-2019 04:30 UTC. This pattern is still in the process of forming. Possible bearish price movement towards the support 109.3100 within the next 16 hours. Supported by Downward sloping Moving Average Chart 30 MinutesPattern Falling WedgeLength 105 CandlesIdentified 25-Dec-2019 04:30 UTC
Big movement expected on NZD/USD after a breach of 0.6623
NZD/USD has broken through a line of 0.6623 and suggests a possible movement to 0.6615 within the next…
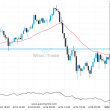
Breach of support could mean a start of a bearish trend on SPX500
SPX500 has broken through a support line of a Rising Wedge chart pattern. If this breakout holds true,…
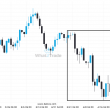
After testing resistance twice in the past, BCHAUD has finally broken through. Can we expect a bullish trend to follow?
The breakout of BCHAUD through the resistance line of a Channel Down could be a sign of the…