
Day: December 1, 2019
3 posts
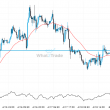
After testing 1.2957 numerous times, GBP/USD is once again approaching this price point. Can we expect a bullish trend to follow?
The movement of GBP/USD towards 1.2957 price line is yet another test of the line it reached numerous…
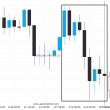
Breach of support could mean a start of a bearish trend on SPX500
SPX500 has broken through a support line of a Descending Triangle chart pattern. If this breakout holds true,…
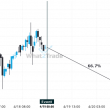
EUR/USD Target Level: 1.1038
Channel Down has broken through the resistance line at 29-Nov-2019 16:00 UTC. Possible bullish price movement forecast for the next 15 hours towards 1.1038. Supported by Upward sloping Moving Average Chart 1 hourPattern Channel DownLength 66 CandlesIdentified 29-Nov-2019 16:00 UTC