
Day: November 26, 2019
21 posts
Breach of resistance could mean a start of a bullish trend on EUR/USD
EUR/USD has broken through a resistance line of a Triangle chart pattern. If this breakout holds true, we…
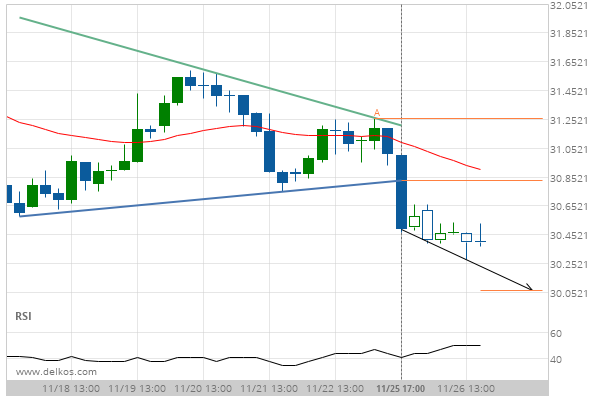
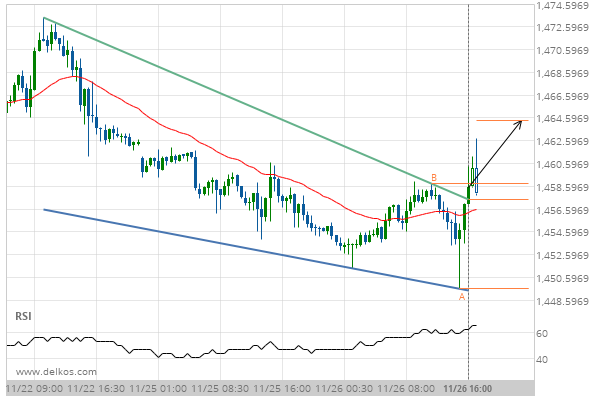
Breach of support could mean a start of a bearish trend on FRA40
FRA40 has broken through a support line of a Rising Wedge chart pattern. If this breakout holds true,…
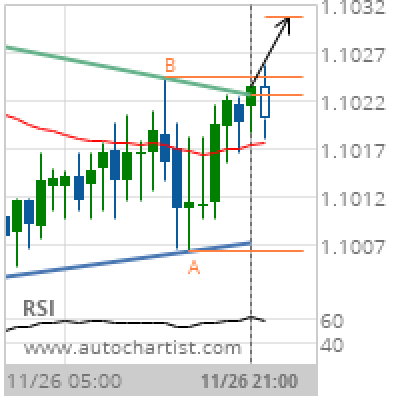
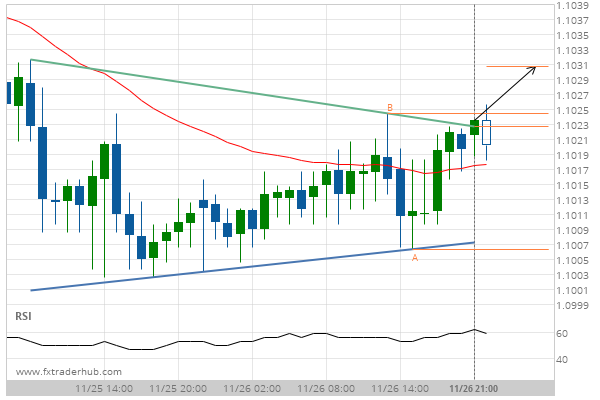
EUR/USD Target Level: 1.1031
Triangle has broken through the resistance line at 26-Nov-2019 21:00 UTC. Possible bullish price movement forecast for the next 10 hours towards 1.1031. Supported by Upward sloping Moving Average Chart 1 hourPattern TriangleLength 36 CandlesIdentified 26-Nov-2019 21:00 UTC
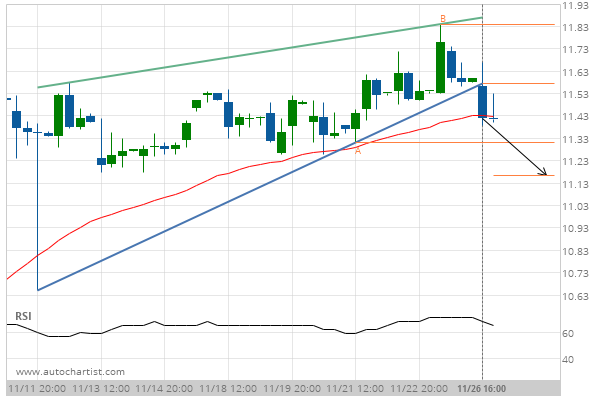
Big movement expected on Soybean Oil JANUARY 2020 after a breach of the support
Soybean Oil JANUARY 2020 has broken through a support line of a Triangle and suggests a possible movement…
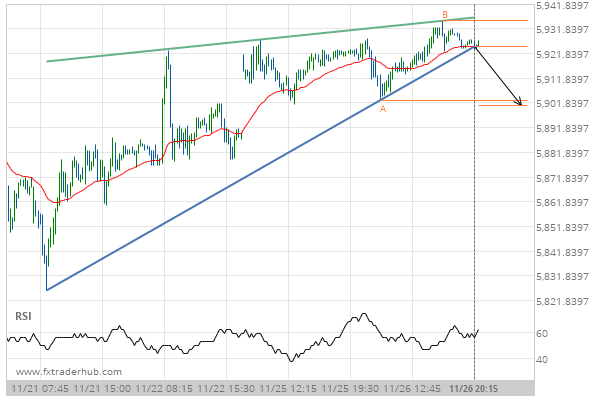
Breach of support could mean a start of a bearish trend on General Electric Co.
General Electric Co. has broken through a support line of a Rising Wedge chart pattern. If this breakout…
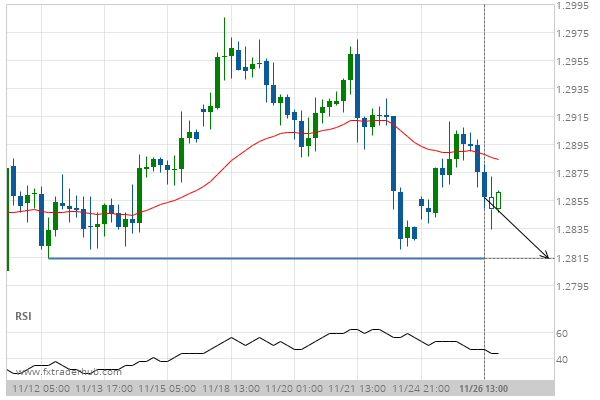
Important price line being approached by GBP/USD. This price has been tested numerous times before.
GBP/USD is moving towards a line of 1.2814 which it has tested numerous times in the past. We…
Big movement expected on Gold DECEMBER 2019 after a breach of the resistance
Gold DECEMBER 2019 has broken through a resistance line of a Falling Wedge and suggests a possible movement…
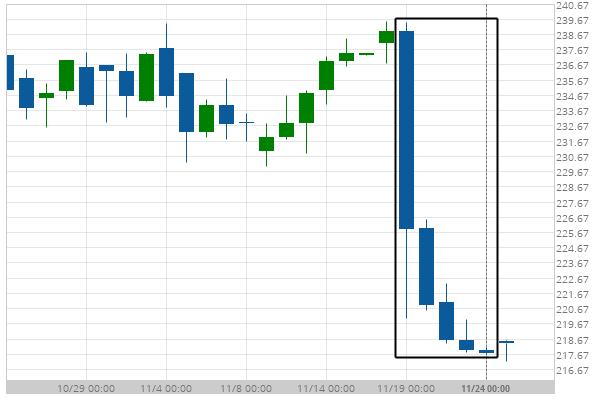
Could a large bearish move on Home Depot Inc. be a sign of things to come?
Home Depot Inc. has experienced an exceptionally large movement lower by 8.95% from 239.1 to 217.7 in the…
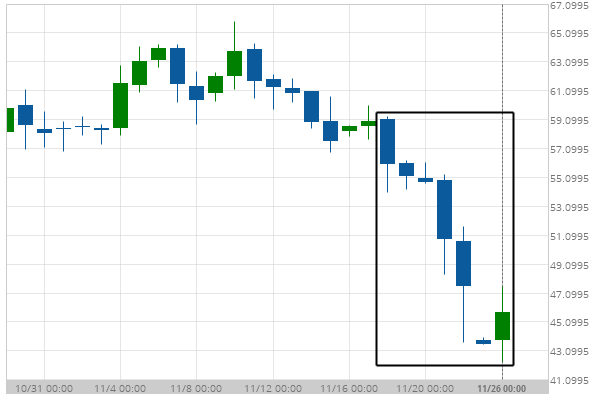
Could a large bearish move on LTCUSD be a sign of things to come?
LTCUSD has experienced an exceptionally large movement lower by 22.59% from 59.1 to 45.75 in the last 9…
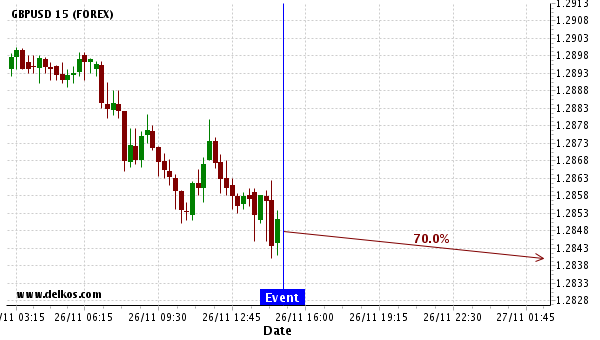
We expect GBPUSD to trend downwards right now.
Based on the last 12 New Home Sales events in United States, we expect GBPUSD to trend downwards…