
Day: November 15, 2019
20 posts
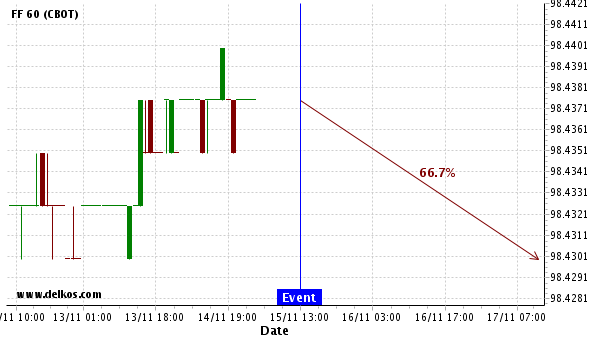
We expect a $0 movement on FF within 48 hours following the release of Retail Sales MoM.
We expect a $0 movement on FF within 48 hours following the release of Retail Sales MoM at…
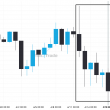
Breach of resistance could mean a start of a bullish trend on FRA40
FRA40 has broken through a resistance line of a Triangle chart pattern. If this breakout holds true, we…
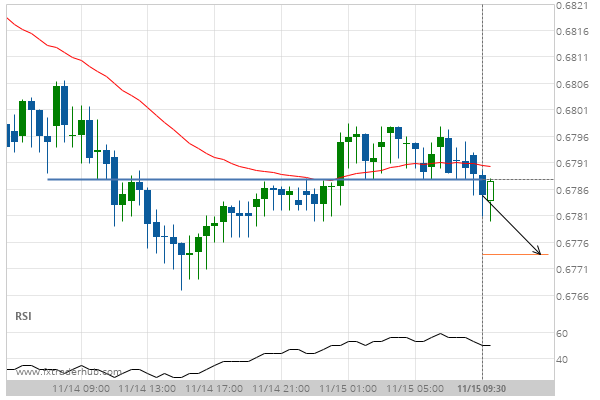
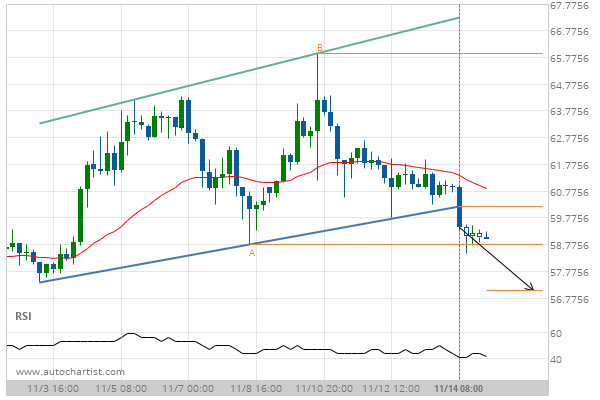
Breach of 0.6788 could mean a start of a bearish trend on AUD/USD
AUD/USD has broken through a line of 0.6788. If this breakout holds true, we expect the price of…
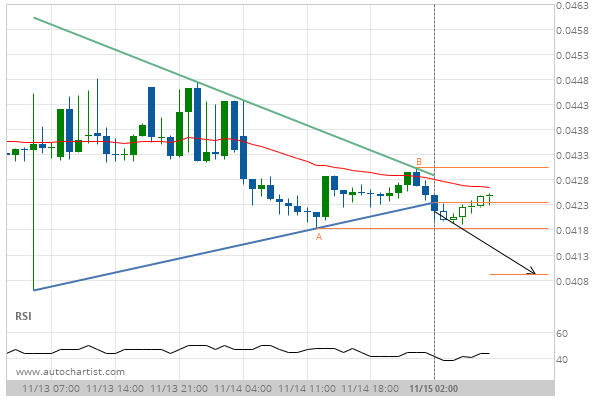
Breach of support could mean a start of a bearish trend on ADAUSD
ADAUSD has broken through a support line of a Triangle chart pattern. If this breakout holds true, we…
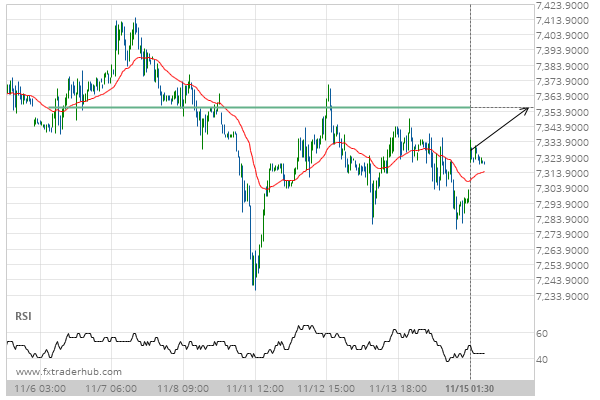
UK100 is quickly approaching 7356.5000. We expect either a breakout through this line, or a rebound.
UK100 is heading towards a line of 7356.5000. If this movement continues, we expect the price of UK100…
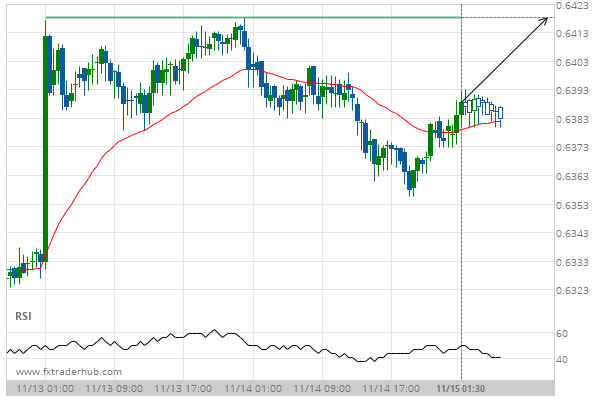
After testing 0.6418 numerous times, NZD/USD is once again approaching this price point. Can we expect a bullish trend to follow?
The movement of NZD/USD towards 0.6418 price line is yet another test of the line it reached numerous…
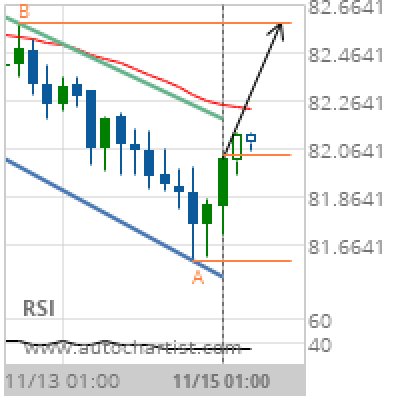
CAD/JPY Target Level: 82.5820
Flag identified at 15-Nov-2019 01:00 UTC. This pattern is still in the process of forming. Possible bullish price movement towards the resistance 82.5820 within the next day. Supported by RSI below 40 Chart 4 hourPattern FlagLength 28 CandlesIdentified 15-Nov-2019 01:00 UTC
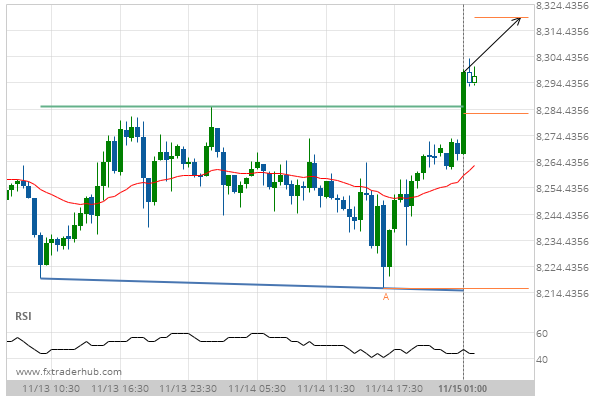
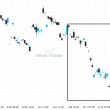
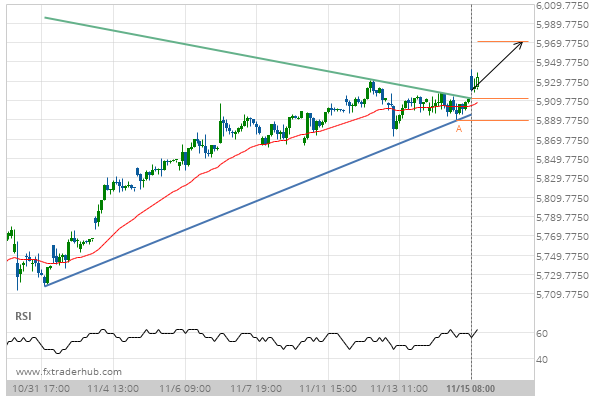
Breach of resistance could mean a start of a bullish trend on NAS100
NAS100 has broken through a resistance line of a Double Bottom chart pattern. If this breakout holds true,…
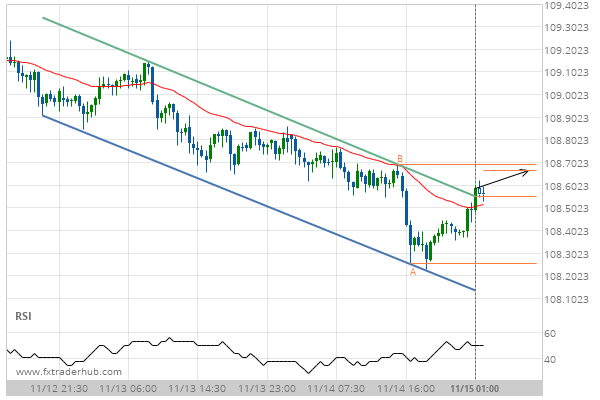
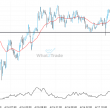
After testing resistance twice in the past, USD/JPY has finally broken through. Can we expect a bullish trend to follow?
The breakout of USD/JPY through the resistance line of a Channel Down could be a sign of the…
Breach of support could mean a start of a bearish trend on LTCUSD
LTCUSD has broken through a support line of a Channel Up chart pattern. If this breakout holds true,…