
Day: November 7, 2019
25 posts
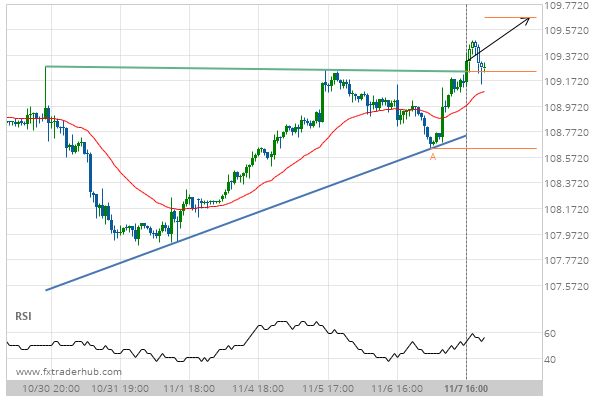
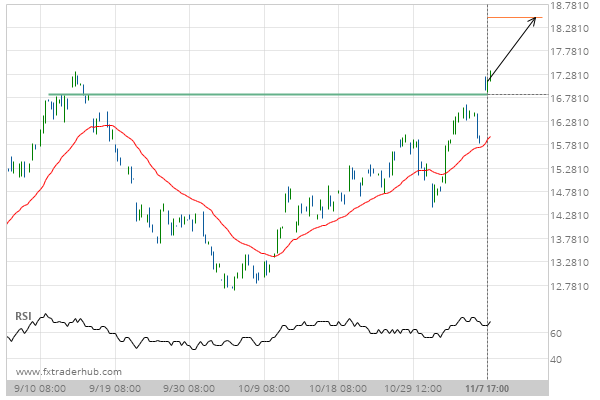
Breach of resistance could mean a start of a bullish trend on USD/JPY
USD/JPY has broken through a resistance line of a Ascending Triangle chart pattern. If this breakout holds true,…
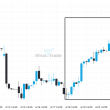
Breach of 16.8600 could mean a start of a bullish trend on FRA40
FRA40 has broken through a line of 16.8600. If this breakout holds true, we expect the price of…
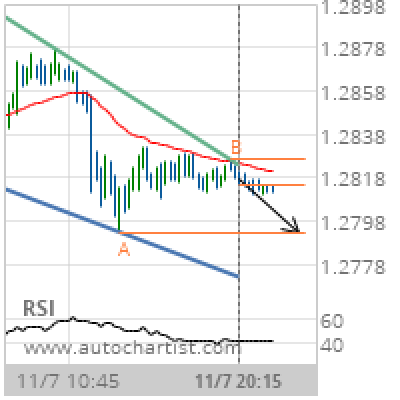
GBP/USD Target Level: 1.2793
Falling Wedge identified at 07-Nov-2019 20:15 UTC. This pattern is still in the process of forming. Possible bearish price movement towards the support 1.2793 within the next 6 hours. Supported by Downward sloping Moving Average Chart 15 MinutesPattern Falling WedgeLength 88 CandlesIdentified 07-Nov-2019 20:15 UTC
Support line breached by Wheat DECEMBER 2019. This price has been tested at least twice before.
Wheat DECEMBER 2019 has broken through the support line which it has tested twice in the past. We…
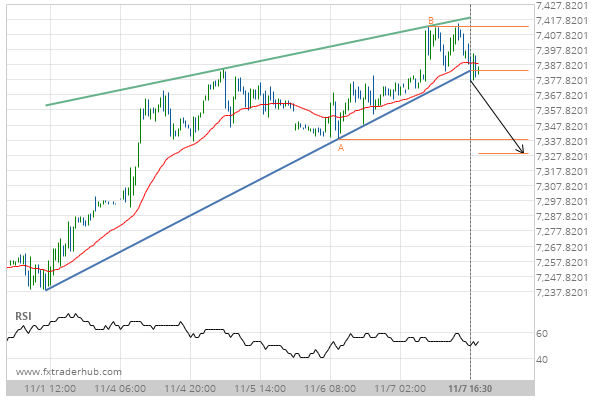
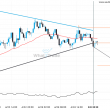
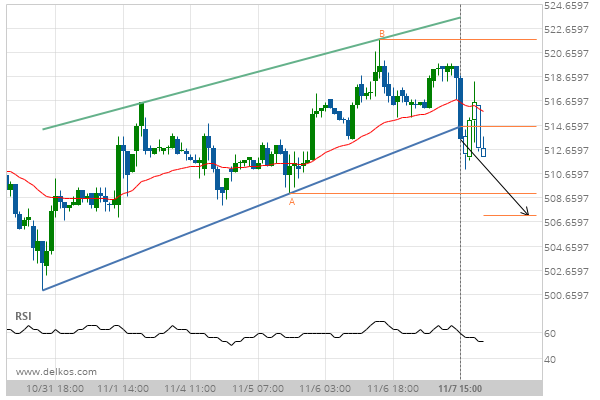
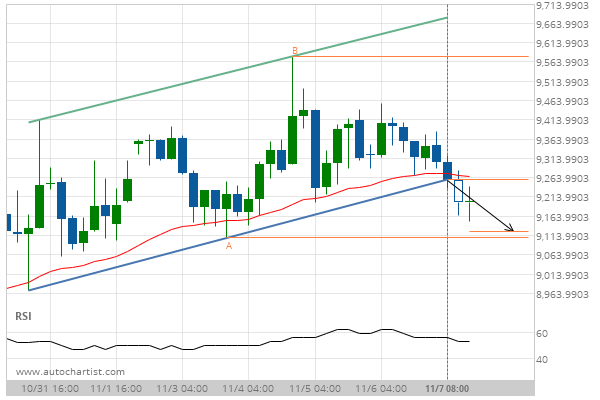
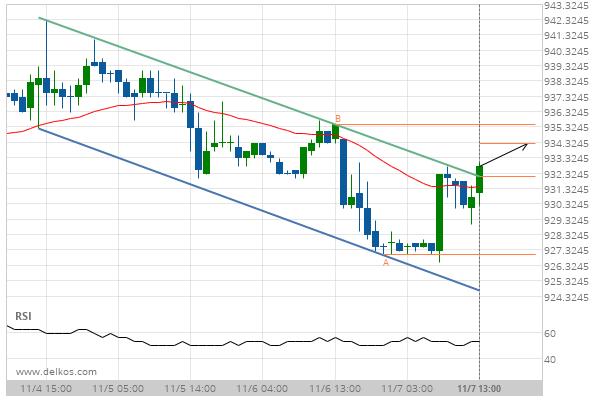
Breach of support could mean a start of a bearish trend on UK100
UK100 has broken through a support line of a Rising Wedge chart pattern. If this breakout holds true,…
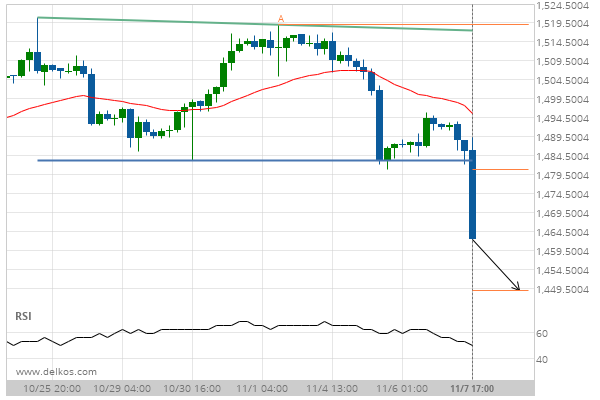
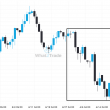
Breach of support could mean a start of a bearish trend on Gold DECEMBER 2019
Gold DECEMBER 2019 has broken through a support line of a Double Top chart pattern. If this breakout…
Breach of support could mean a start of a bearish trend on BTCUSD
BTCUSD has broken through a support line of a Channel Up chart pattern. If this breakout holds true,…
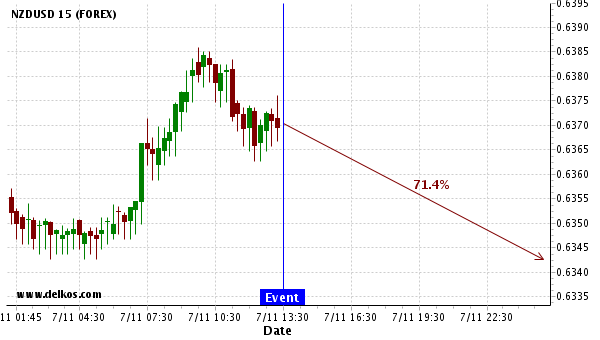
We expect a $310 movement on NZDUSD within the next 12 hours.
Based on the last 12 Continuing Jobless Claims events in United States, we expect a $310 movement on…
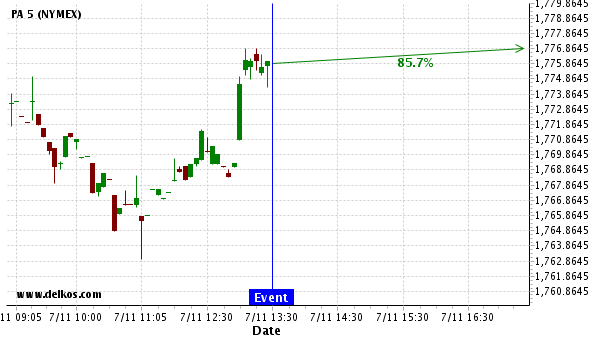
We expect a $52,285.44 movement on PA within the next 4 hours.
Based on the last 12 Continuing Jobless Claims events in United States, we expect a $52,285.44 movement on…
Big movement expected on Soybeans JANUARY 2020 after a breach of the resistance
Soybeans JANUARY 2020 has broken through a resistance line of a Channel Down and suggests a possible movement…