
Day: May 31, 2019
25 posts
Support line breached by Soybean Meal JULY 2019. This price has been tested at least twice before.
Soybean Meal JULY 2019 has broken through the support line which it has tested twice in the past.…
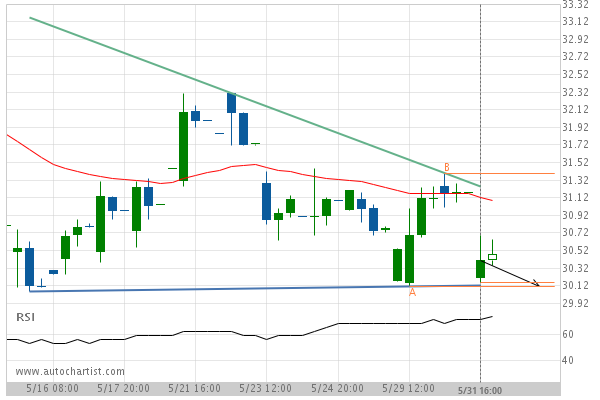
A quick move expected on DowDuPont as it starts approaching a support line of a Descending Triangle
DowDuPont is heading towards the support line of a Descending Triangle and could reach this point within the…
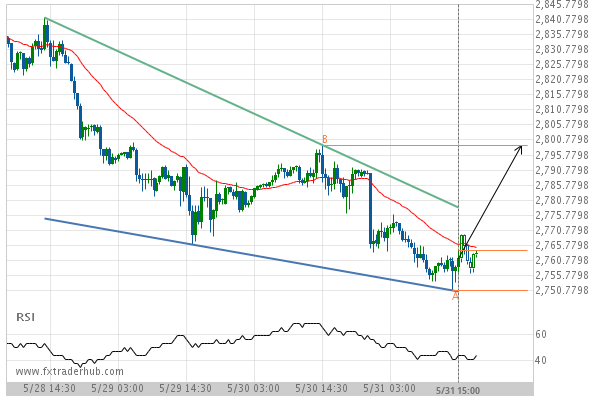
SPX500 is quickly approaching the resistance line of a Falling Wedge. We expect either a breakout through this line or a rebound.
SPX500 is heading towards the resistance line of a Falling Wedge. If this movement continues, we expect the…
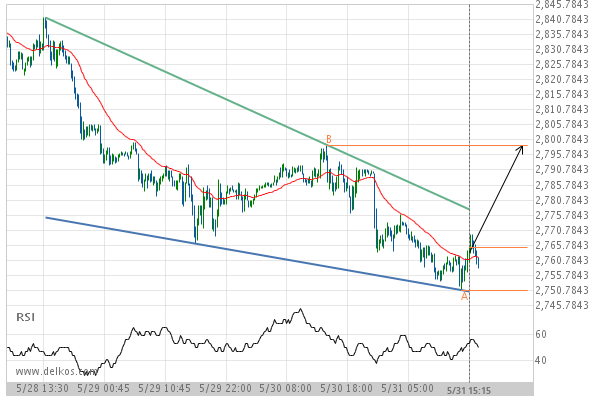
After testing the resistance line numerous times, E-mini S&P 500 JUNE 2019 is once again approaching this line. Can we expect a bullish trend to follow?
The movement of E-mini S&P 500 JUNE 2019 towards the resistance line of a Falling Wedge is yet…
BCHGBP has broken through the resistance line of a Resistance. It has touched this line numerous times in the last 3 days.
BCHGBP has broken through the resistance line of a Resistance. It has touched this line numerous times in…
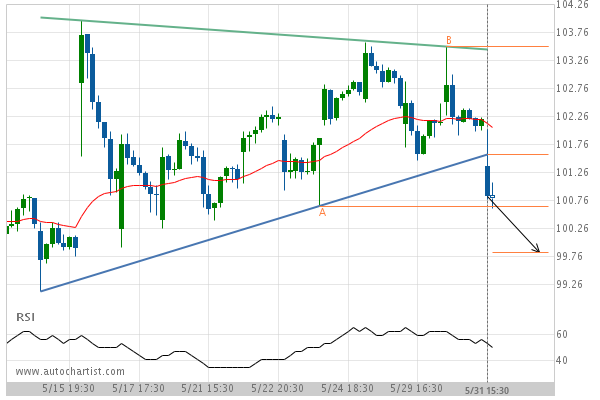
After testing support twice in the past, Wal-Mart Stores has finally broken through. Can we expect a bearish trend to follow?
The breakout of Wal-Mart Stores through the support line of a Triangle could be a sign of the…
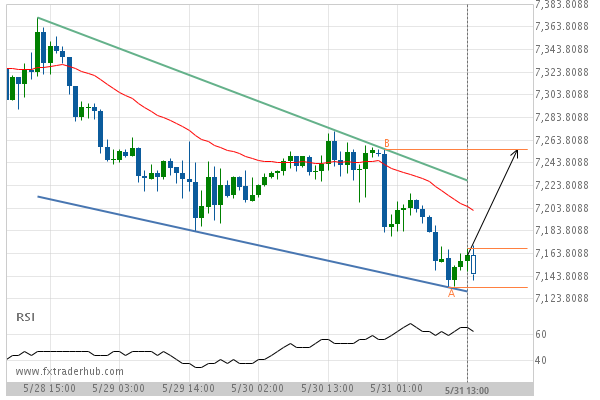
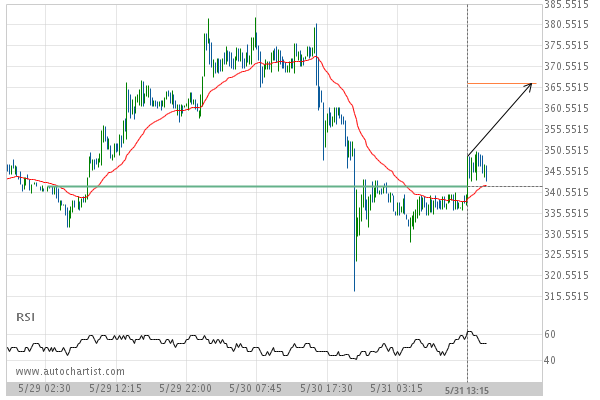
Important resistance line being approached by NAS100. This price has been tested numerous time in the last 4 days
NAS100 is moving towards the resistance line of a Falling Wedge which it has tested numerous times in…
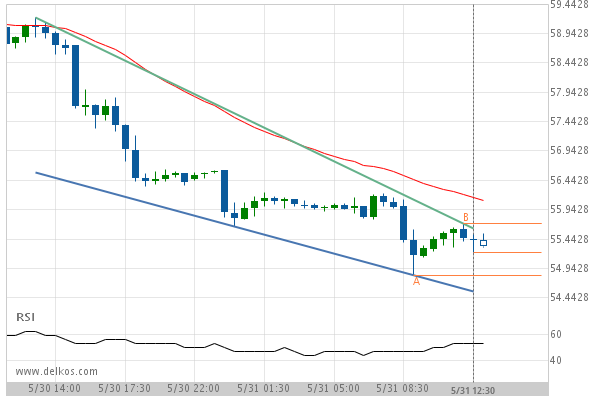
Light Sweet Crude Oil JULY 2019 – approaching a support line that has been previously tested at least twice in the past
Light Sweet Crude Oil JULY 2019 is moving towards the support line of a Falling Wedge. Because we…
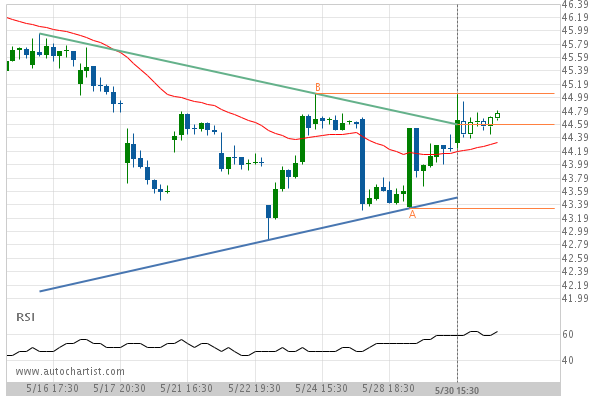
Intel Corporation – breach of a trending resistance line that has been tested at least twice before.
Intel Corporation has broken through the resistance line of a Triangle technical chart pattern. Because we have seen…
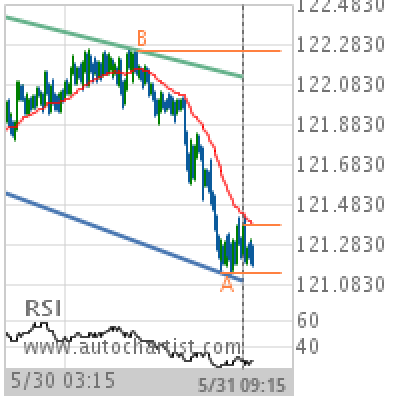
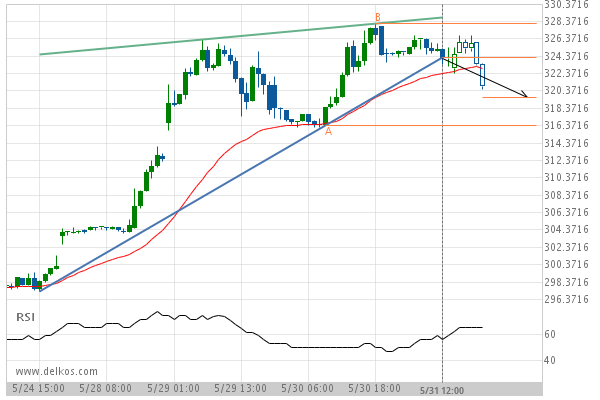
EUR/JPY Target Level: 122.2500
Channel Down identified at 31-May-2019 09:15 UTC. This pattern is still in the process of forming. Possible bullish price movement towards the resistance 122.2500 within the next 21 hours. Supported by RSI below 40 Chart 15 MinutesPattern Channel DownLength 268 CandlesIdentified 31-May-2019 09:15 UTC