
Day: May 23, 2019
19 posts
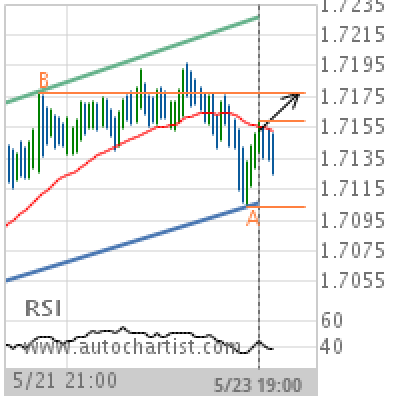
EUR/NZD Target Level: 1.7178
Channel Up identified at 23-May-2019 19:00 UTC. This pattern is still in the process of forming. Possible bullish price movement towards the resistance 1.7178 within the next day. Supported by RSI below 40 Chart 1 hourPattern Channel UpLength 101 CandlesIdentified 23-May-2019 19:00 UTC
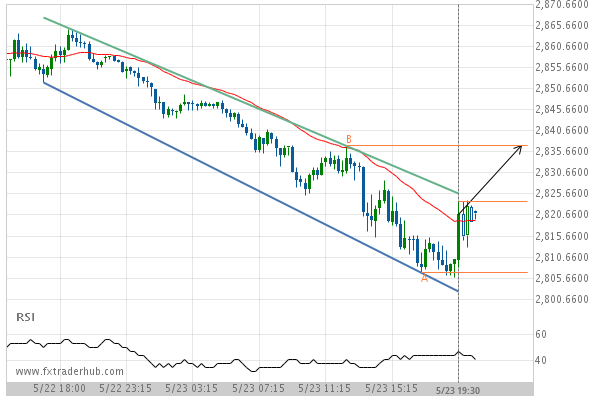
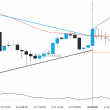
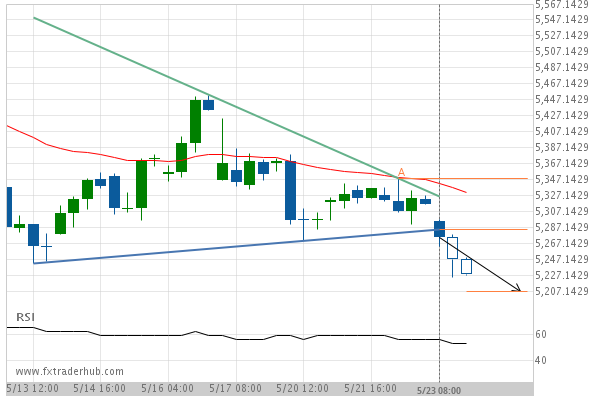
Important resistance line being approached by SPX500. This price has been tested numerous time in the last 2 days
SPX500 is moving towards the resistance line of a Channel Down which it has tested numerous times in…
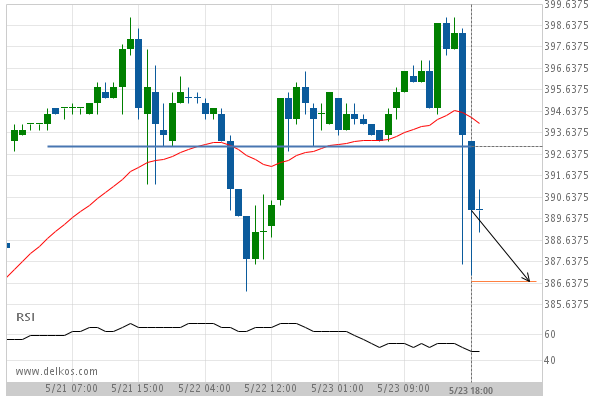
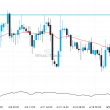
After testing 393.0000 numerous times, CORN JULY 2019 has finally broken through. Can we expect a bearish trend to follow?
The breakout of CORN JULY 2019 through the 393.0000 price line is a breach of an important psychological…
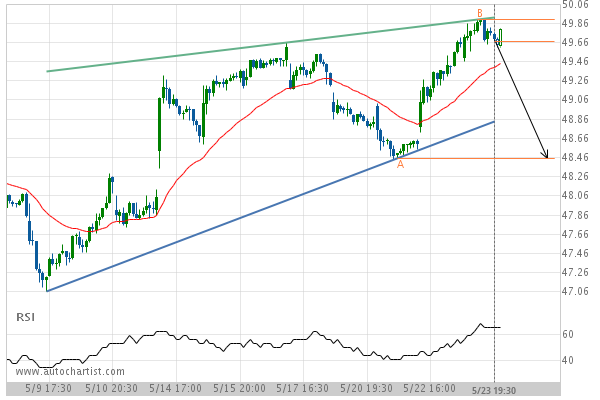
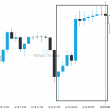
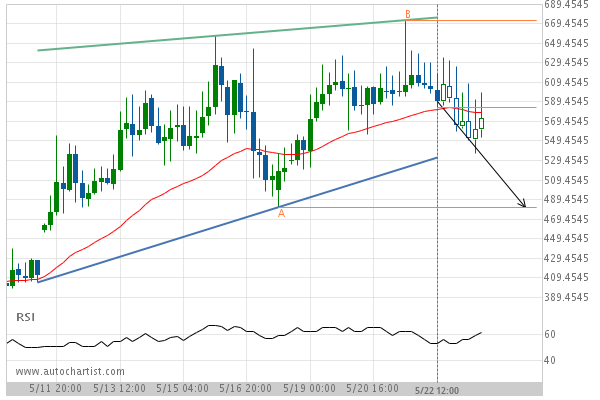
A quick move expected on Coca-Cola Co. as it starts approaching a support line of a Rising Wedge
Coca-Cola Co. is heading towards the support line of a Rising Wedge and could reach this point within…
NAS100 – approaching a resistance line that has been previously tested at least twice in the past
NAS100 is moving towards the resistance line of a Channel Down. Because we have seen it retrace from…
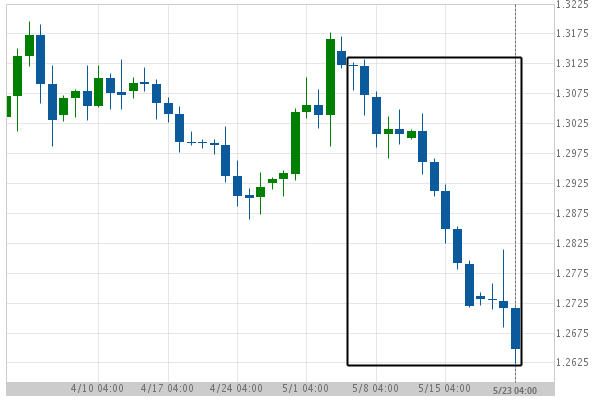
GBP/USD experienced a very large 18 days bearish move to 1.265
GBP/USD has moved lower by 3.62% from 1.312 to 1.265 in the last 18 days.
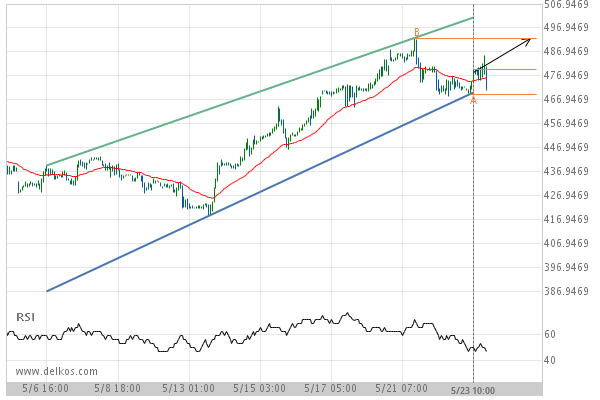
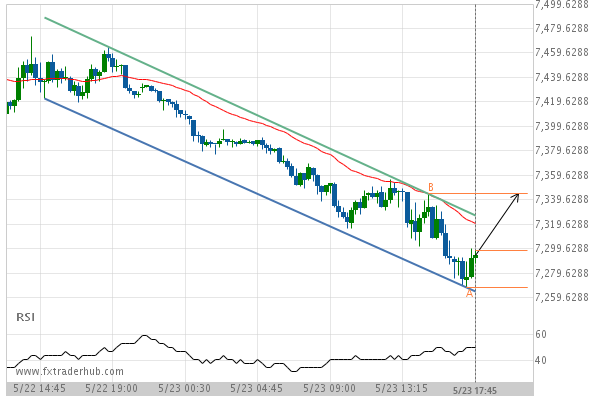
Important resistance line being approached by Wheat JULY 2019. This price has been tested numerous time in the last 17 days
Wheat JULY 2019 is moving towards the resistance line of a Channel Up which it has tested numerous…
A quick move expected on BCHAUD as it starts approaching a support line of a Rising Wedge
BCHAUD is heading towards the support line of a Rising Wedge and could reach this point within the…
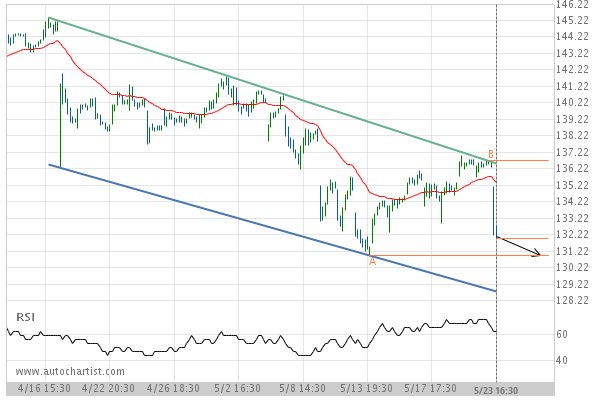
International Business Machines Corp. is quickly approaching the support line of a Channel Down. We expect either a breakout through this line or a rebound.
International Business Machines Corp. is heading towards the support line of a Channel Down. If this movement continues,…
After testing support twice in the past, FRA40 has finally broken through. Can we expect a bearish trend to follow?
The breakout of FRA40 through the support line of a Triangle could be a sign of the road…