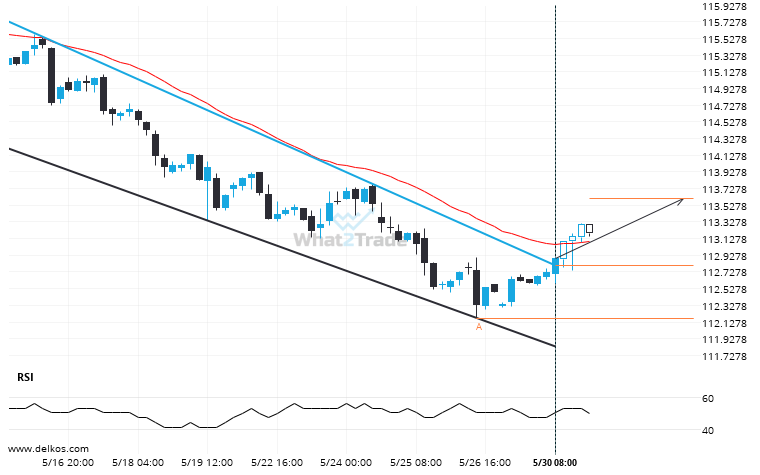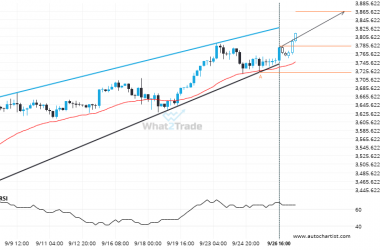
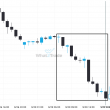
10 year US Treasury Note JUNE 2023 has broken through a resistance line. It has touched this line at least twice in the last 18 days. This breakout may indicate a potential move to 113.6105 within the next 3 days. Because we have seen it retrace from this position in the past, one should wait for confirmation of the breakout before trading.
10 year US Treasury Note JUNE 2023 has broken through resistance of a Channel Down. It has touched this line at least twice in the last 18 days.