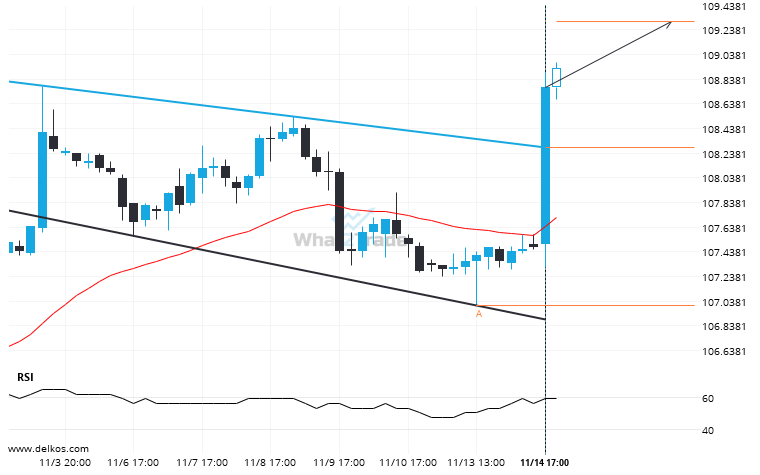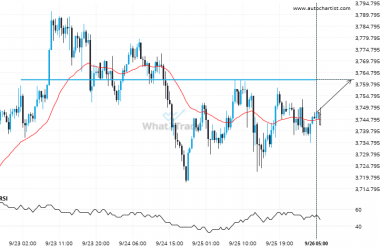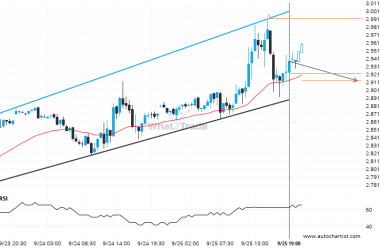
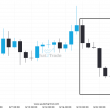
10 year US Treasury Note DECEMBER 2023 moved through the resistance line of a Channel Down at 108.28125 on the 4 hour chart. This line has been tested a number of times in the past and this breakout could mean an upcoming change from the current trend. It may continue in its current direction toward 109.3062.
10 year US Treasury Note DECEMBER 2023 has broken through resistance of a Channel Down. It has touched this line at least twice in the last 14 days.