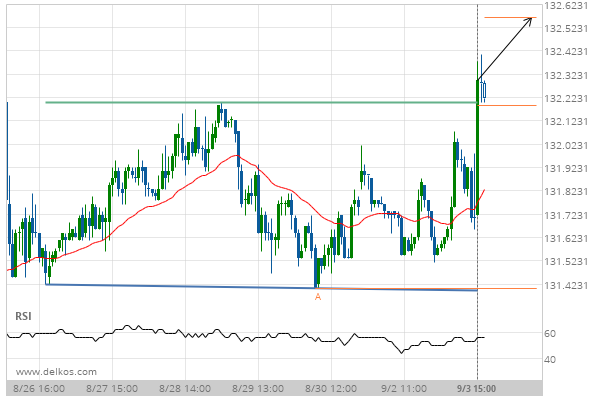
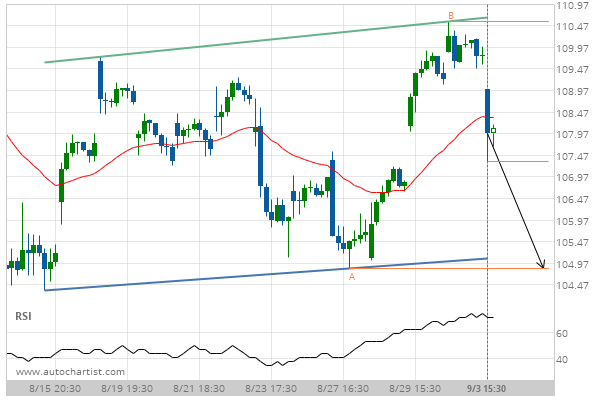
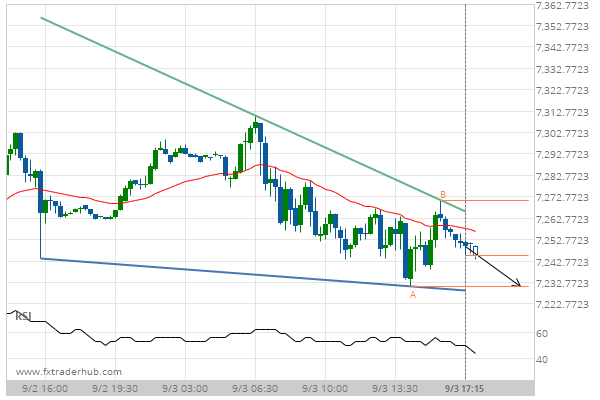
10 year US Treasury Note DECEMBER 2019 has broken through the resistance line of a Double Bottom technical chart pattern. Because we have seen it retrace from this position in the past, one should wait for confirmation of the breakout before trading. It has touched this line twice in the last 8 days and suggests a target line to be around 132.5647 within the next 2 days.
Related Posts
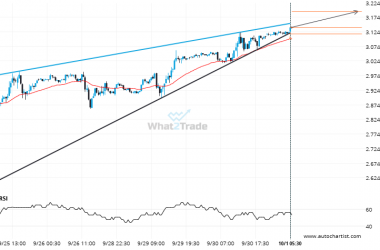
A Rising Wedge has formed, Natural Gas is approaching support. Can we expect a breakout and the start of a new trend or a reversal?
Natural Gas was identified at around 3.1395 having recently rebounded of the support on the 30 Minutes data…
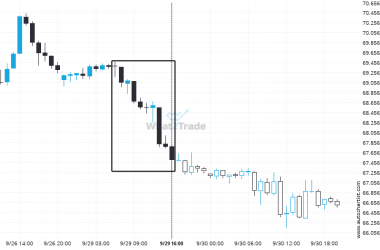
An unexpected large move occurred on Brent Crude 1 hour chart. The shift stands out in recent activity.
Brent Crude just posted a 2.7% move over the past 10 hours – a move that won’t go…
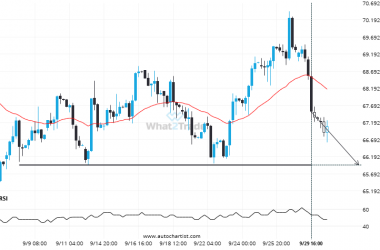
If you’re long Brent Crude you should be aware of the rapidly approaching level of 65.9405
The price of Brent Crude in heading back to the support area. It is possible that it will…

