
Day: June 11, 2019
20 posts
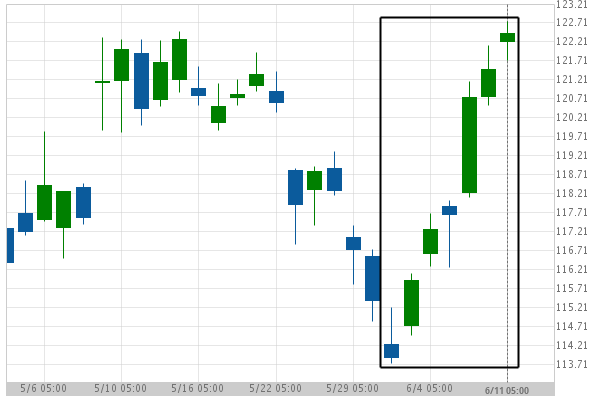
Chevron moves higher to 122.42 in the last 12 days.
A movement of 7.18% over 12 days on Chevron doesn’t go unnoticed. You may start considering where it’s…
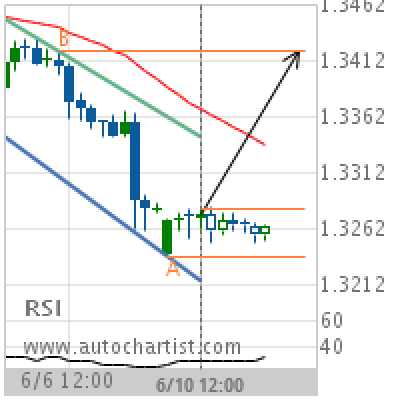
USD/CAD Target Level: 1.3419
Channel Down identified at 10-Jun-2019 12:00 UTC. This pattern is still in the process of forming. Possible bullish price movement towards the resistance 1.3419 within the next 15 hours. Supported by RSI below 40 Chart 4 hourPattern Channel DownLength 31 CandlesIdentified 10-Jun-2019 12:00 UTC
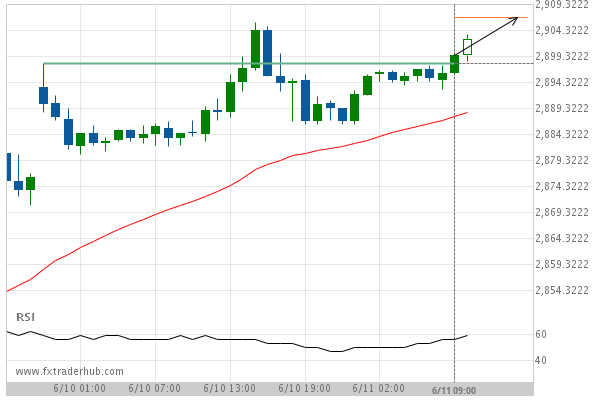
SPX500 – breach of price line thats been previously tested numerous times before
SPX500 has broken through the resistance line of a Resistance. Because we have seen it retrace from this…
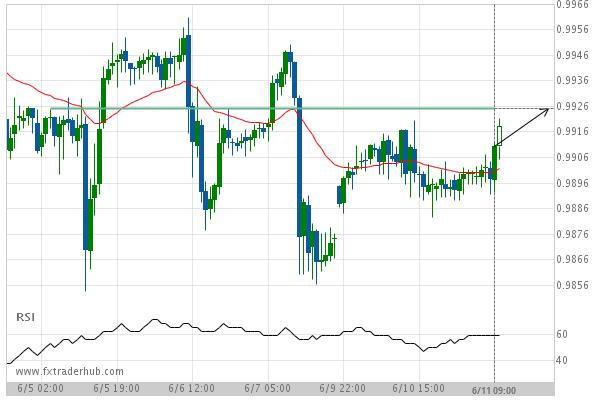
USD/CHF – approaching a price line that has been previously tested numerous times in the past
USD/CHF is moving towards the resistance line of a Resistance. Because we have seen it retrace from this…
LTCUSD is quickly approaching the resistance line of a Rising Wedge. We expect either a breakout through this line or a rebound.
LTCUSD is heading towards the resistance line of a Rising Wedge. If this movement continues, we expect the…
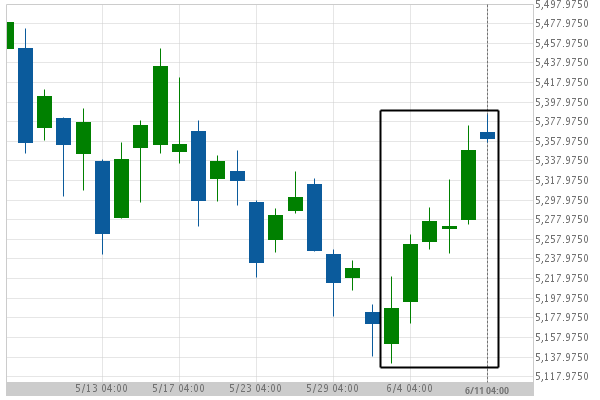
FRA40 experienced a very large 9 days bullish move to 5,359.5
FRA40 has moved higher by 4.06% from 5,150.5 to 5,359.5 in the last 9 days.
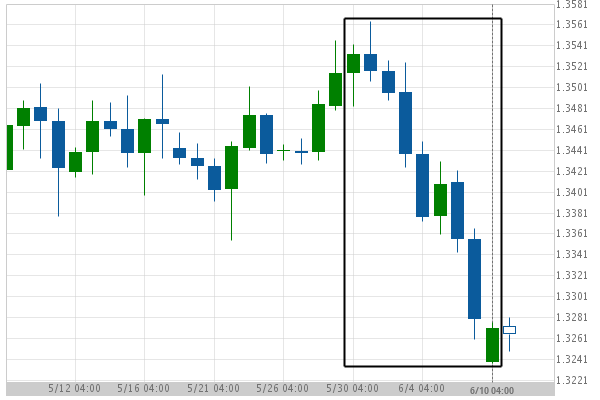
USD/CAD experienced a very large 12 days bearish move to 1.327
USD/CAD has moved lower by 1.8% from 1.351 to 1.327 in the last 12 days.
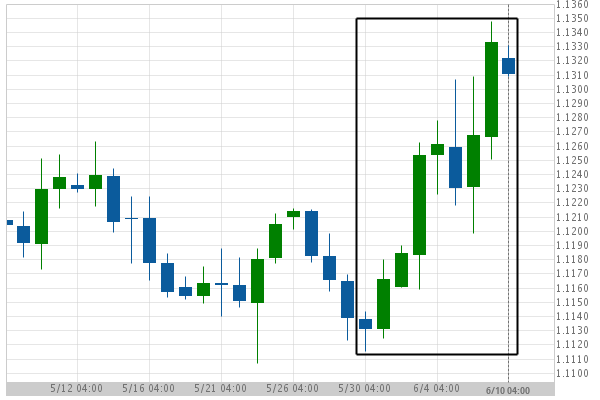
EUR/USD experienced a very large 12 days bullish move to 1.131
EUR/USD has moved higher by 1.55% from 1.114 to 1.131 in the last 12 days.
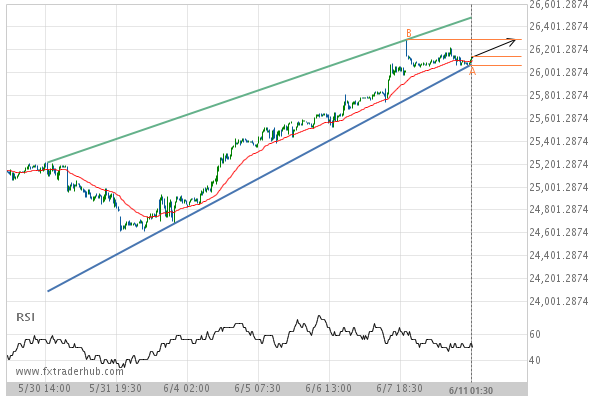
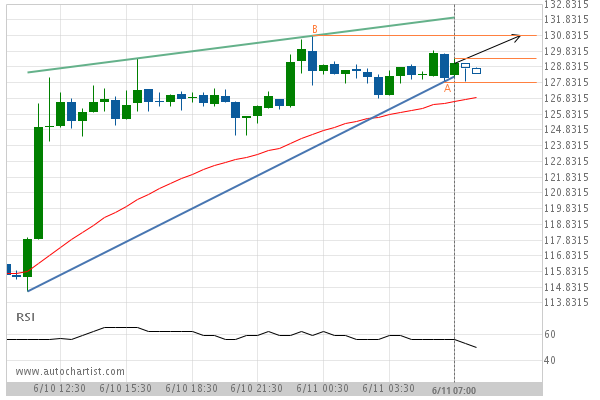
After testing the resistance line numerous times, US30 is once again approaching this line. Can we expect a bullish trend to follow?
The movement of US30 towards the resistance line of a Rising Wedge is yet another test of the…
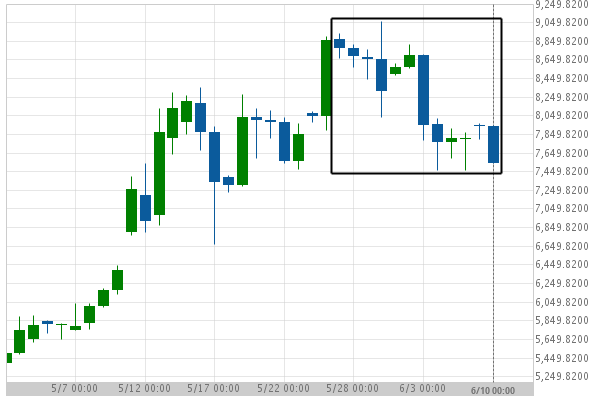
BTCUSD hits 7,540.27 after a 14.93% move spanning 15 days
For those of you that don’t believe in trends, this may be an opportunity to take advantage of…